This year, I subscribed to a paid service: How They Make Money.
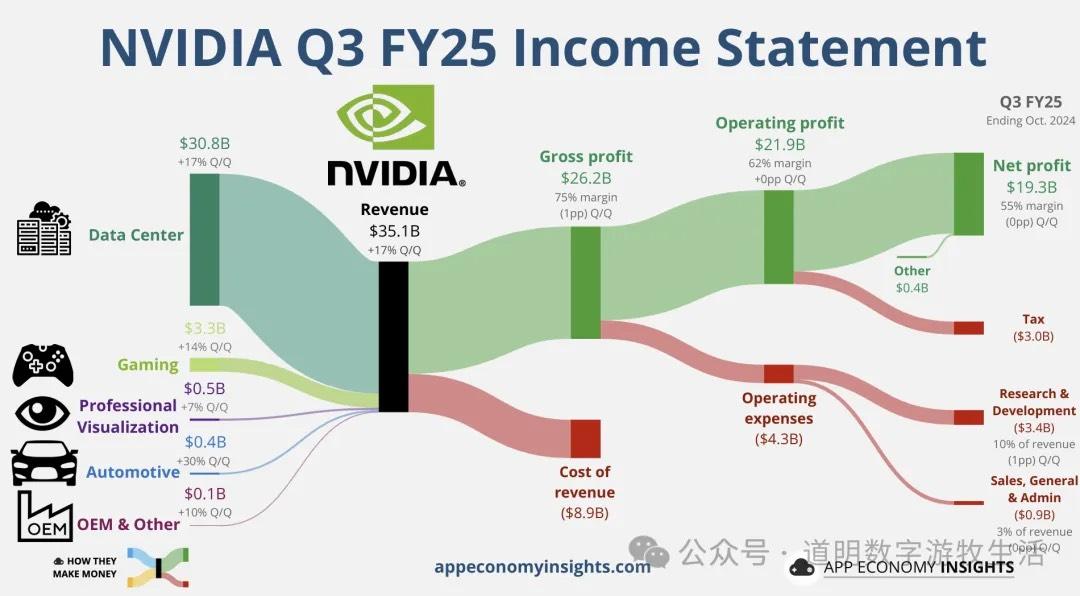
What first caught my eye were the Sankey charts for financial report analysis, such as this one for NVIDIA.
In today's fast-paced market, only a service like this allows me to process as much information as possible in the shortest amount of time.
However, beyond just viewing, I need to process this information quickly and integrate it into my own knowledge network, as shown below.
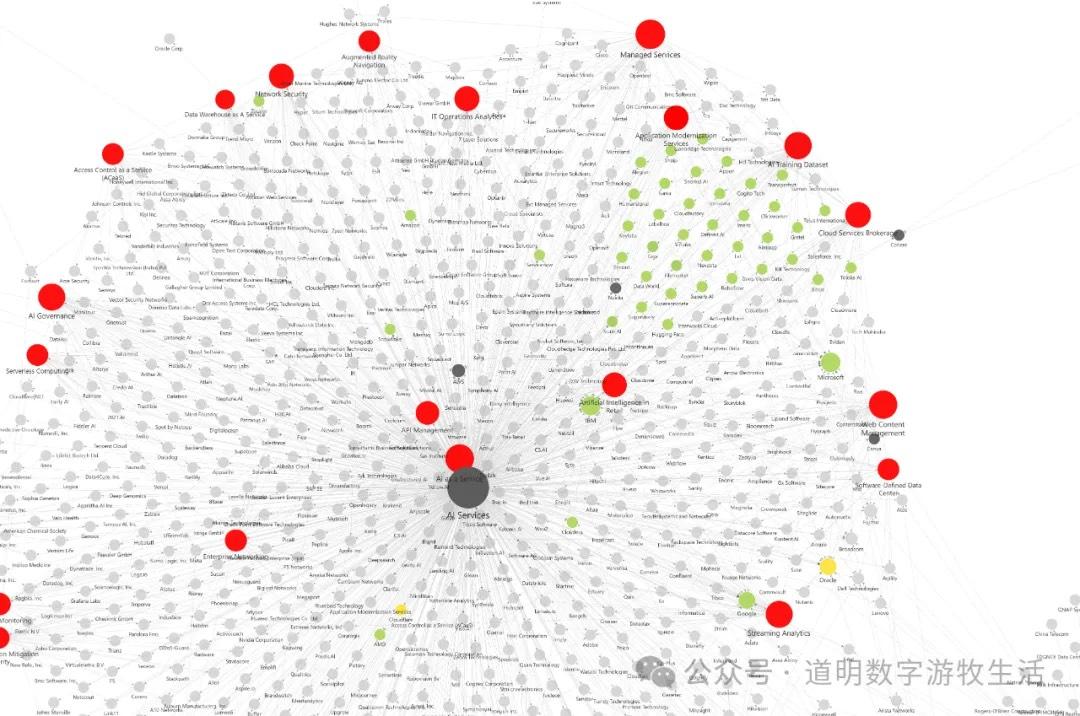
While manual work remains a guarantee of quality, in the era of large models, the introduction of numerous Agents is both a trend and a necessity.
Indeed, over the past week, I spent a lot of "sharpening time" adjusting my agents. The dilemma was never whether to finish the task, but rather: if model capabilities keep improving, is purely consumptive "sharpening time" worth it right now?
Then, Gemini 2.0 arrived, and my potential "sharpening time" was saved once again.
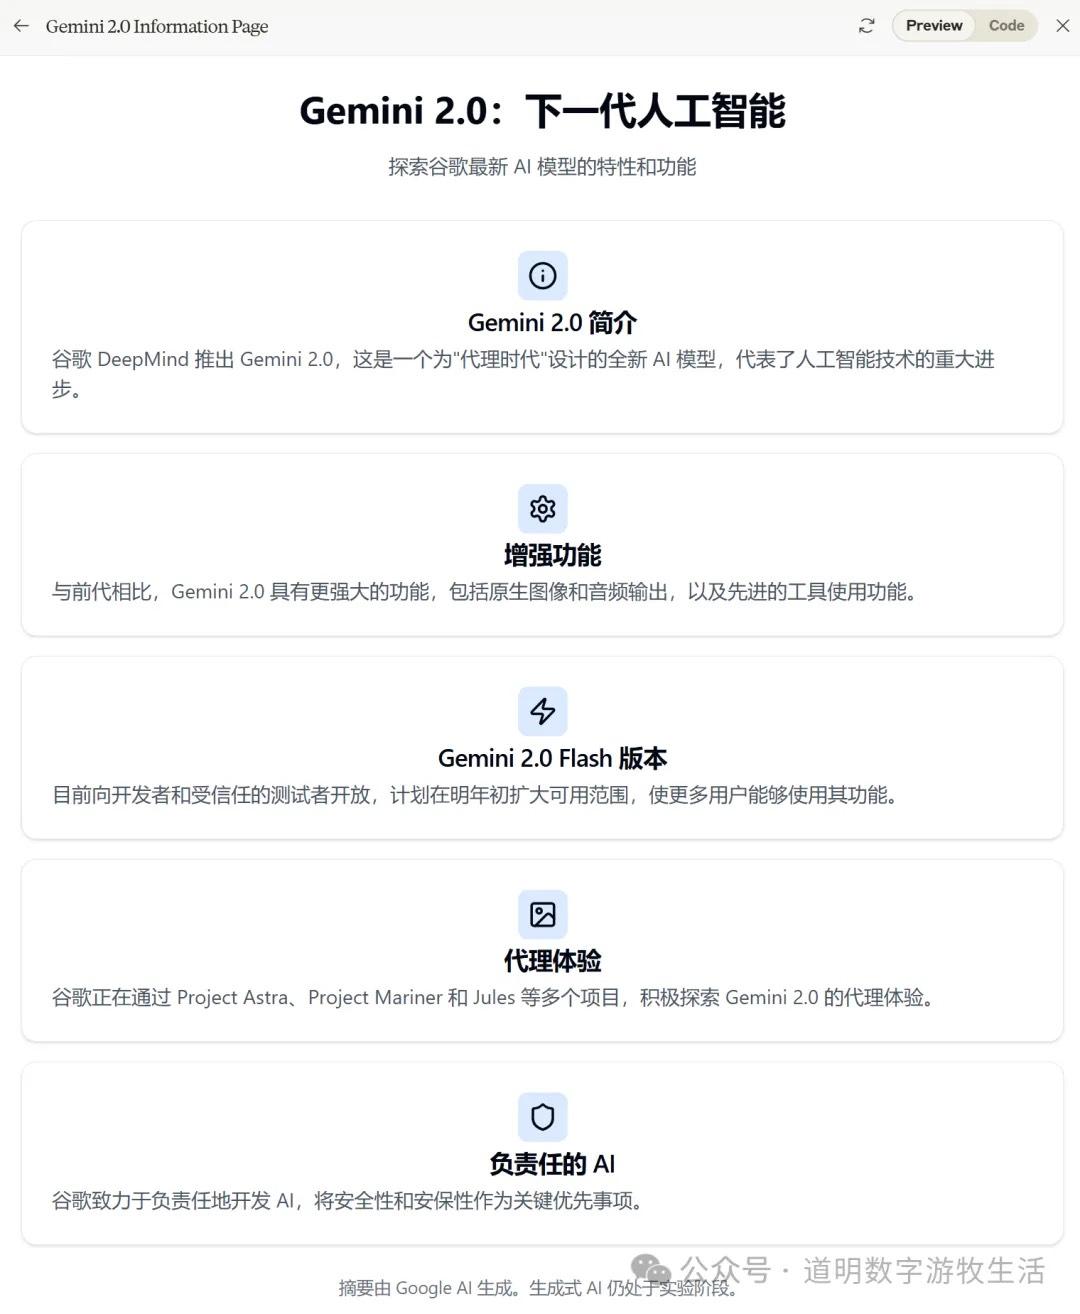
Regarding the release of Gemini 2.0 early this morning, I used Claude 3.5 to create a summary slide as usual.
Next are the results of my analysis of a batch of companies using the latest Gemini 2.0. My goals were simple:
- Summarize and categorize as much as possible to identify key focus points (Attention) for knowledge base linking;
- Ensure completeness and accuracy.
In a Q&A session lasting 380.5 seconds, Gemini 2.0 achieved both.
I use Gemini for serious work and Claude for coding. After being interrupted by OpenAI's "12-day slow-drip" release schedule, I've returned to my normal rhythm.
Below is the full output (Disclaimer: Not investment advice):
Summary
This document provides a detailed analysis of companies across various industries, primarily using Sankey charts to illustrate income statements. These visualizations clearly show how revenue flows through a business into different expense categories, ultimately impacting net profit. The companies analyzed range from tech giants like NVIDIA and Qualcomm to established consumer brands like Hershey and Starbucks. Across all sectors, the importance of R&D investment, strong customer retention, and effective sales and marketing is evident. Key trends include the growth of digital platforms, the shift toward recurring revenue models, and the impact of technology on traditional industries. The document also highlights different paths to profitability; many companies are investing heavily in long-term sustainable growth, while others focus on cost management and efficiency.
Company Analysis Table (Key Financial Data)
| Company Name | Sector | Main Revenue Sources | Key Profit Drivers | Main Operating Expenses | Key Growth Drivers | Key Financials (Millions) |
|---|---|---|---|---|---|---|
| NVIDIA | Tech (Semiconductor) | Data Center, Gaming, Other | Leadership in AI/HPC market | R&D, Sales & Marketing | AI chip demand | Rev: Data Center(30,771), Gaming(3,279) |
| Qualcomm | Tech (Semiconductor) | QCT (Chips), QTL (License) | High QTL margin, chip sales | R&D | Diversification (Mobile/Auto/IoT) | Rev: 10,200, GP: 5,800, NI: 2,900 |
| Applied Materials | Tech (Semiconductor) | Semi Systems, Foundry, Flash | Chip manufacturing investment | R&D | Semi Capex trends | Rev: 7,000, GP: 3,300, NI: 1,700 |
| Arm Holdings | Tech (Semiconductor) | Licensing, Royalties | High IP margins | R&D | Chip design leadership | Rev: 844, GP: 812, NI: 107 |
| Samsung | Tech (Electronics) | Device Exp, Solutions, Display | Brand, Semi/Component sales | R&D, Sales & Marketing | Diverse product portfolio | Sales: 79.1T, NI: 10.1T (KRW) |
| Tencent | Tech (Internet) | Games, Social, Ads, Fintech | Game revenue, diverse platform | R&D | Social/Payment expansion | Rev: 1,672, NI: 540 (RMB 100M) |
| Nintendo | Gaming | Software, Hardware, IP | Hit software, IP value | R&D, Sales & Marketing | Hit releases, Digital distro | Rev: 523, NI: 109 (JPY 100M) |
| Lyft | Ride-hailing | Rideshare, Rentals | Core business growth, cost mgmt | G&A, Marketing, R&D | Geo expansion, pricing mgmt | Rev: 1,523, GP: 634, Op Loss: (57) |
| Grab | Tech (Super-app) | Delivery, Mobility, Fintech | Platform growth, engagement | R&D, S&M, Operations | Super-app expansion | Rev: 716, GP: 307, Op Loss: (38) |
| Home Depot | Retail (Home Imp.) | Construction, Decor, Hardware | Brand, store ops, cost mgmt | Ops, S&A | Consumer home spending | Net Sales: 40,200, NI: 3,600 |
| Target | Retail (Dept.) | Apparel, Beauty, Food, Home | Diverse retail segments | S&A | Multi-category sales, Brand | Rev: 25,700, NI: 900 |
| Spotify | Tech (Streaming) | Premium, Ad-supported | Premium subs, engagement | R&D, Marketing | Sub growth, Ad revenue | Rev: 3,988, NI: 300 (EUR) |
| NetEase | Tech (Gaming/Content) | Games, Cloud Music, Other | Strong game portfolio | R&D | Market growth, Innovation | Rev: 3,700, NI: 1,000 |
| Tech (Social Media) | Global Advertising | Ad revenue, user engagement | R&D, Marketing | User growth, ad effectiveness | Rev: 898, GP: 711, Op Loss: (6) | |
| Match Group | Tech (Online Dating) | Tinder, Hinge, etc. | Subscription rev, brand portfolio | Sales & Marketing | Online dating growth | Rev: 895, NI: 136 |
| Duolingo | Tech (Education) | Subscriptions, Ads | DAU & Paid user growth | R&D, Marketing | User base expansion | Rev: 193, NI: 24 |
| NY Times | Media (News) | Subs (Digital/Print), Ads | Digital sub model, content quality | Content, R&D, Marketing | Digital transformation | Not Provided |
| Block | Fintech (Payments) | Square, Cash App, Bitcoin | Volume, user engagement | R&D, Product development | Digital payment adoption | Rev: 6,000, NI: 300 |
| Nu (Nubank) | Fintech (Banking) | Credit Cards, Loans, Services | Acquisition rate, risk mgmt | R&D, Support, Marketing | LatAm market expansion | Rev: 2,943, NI: 553 |
| dLocal | Fintech (Payments) | Cross-border (LatAm/AF/AS) | Cross-border volume | R&D, Technology | Emerging market E-com | Rev: 186, NI: 27 |
| Shopify | Tech (E-commerce) | Merchant solutions, Subs | Merchant services, sub growth | R&D, Sales & Marketing | Platform solution growth | Rev: 2,162, NI: 344 |
| Global-e | Tech (Cross-border) | Service fees, Fulfillment | Tech and logistics edge | R&D, Sales, Ops | Cross-border tech demand | Rev: 176, Op Loss: (21) |
| Starbucks | Retail (F&B) | Beverages, Food, Other | Brand, store ops, loyalty | Store ops, Product costs, G&A | Foot traffic, Loyalty | Rev: 36,200, NI: 3,800 |
| Yum! Brands | Retail (Restaurant) | Sales, Franchise fees | Brand portfolio, agreements | Operating expenses | Brand expansion | Rev: 1,800, NI: 400 |
| Hershey | Retail (Food) | Confectionery, Snacks, Int'l | Brand strength, loyalty | S&M, Product costs | Innovation, Loyalty | Rev: 3,000, NI: 400 |
| Monster Energy | Retail (Energy Drink) | Global sales, Strategic brands | Marketing strength, distribution | S&M, Ops, Distribution | Brand mgmt, Global distro | Rev: 1,881, NI: 371 |
| Celsius | Retail (Energy Drink) | Partners (Pepsi, etc.) | Distribution network, velocity | R&D, S&M | Retail expansion | Profit not provided |
| Ferrari | Auto (Luxury) | Cars, Parts, Sponsorship | Brand exclusivity, high-end sales | R&D, Sales & Marketing | Stable luxury demand | Rev: 1,600, NI: 400 (EUR) |
| Berkshire | Conglomerate | Insurance, Rail, Energy, Mfg | Diverse sources, acquisitions | Operating expenses | Portfolio diversification | Rev: 93,000, NI: 26,400 |
| Occidental | Energy | Oil & Gas, Chemicals | Production volume, chemicals | Ops, Transport | Oil price stability | Rev: 7,200, NI: 1,100 |
| GE Vernova | Energy (Renewable) | Power, Wind, Electrification | Energy transition, innovation | R&D, Equipment costs | Green energy adoption | Rev: 8,900, Op Loss: (400) |
| Expedia | Tech (Travel) | Lodging, Air, Ads | Brand, efficient platform | Marketing, Technology | Online travel growth | Rev: 4,100, NI: 700 |
| Marriott | Hospitality | Mgmt fees, Franchise | Brand, global network | Ops, S&M, G&A | Global hospitality expansion | Rev: 6,300, NI: 600 |
| Man. United | Sports | Commercial, Broadcast, Matchday | Brand recognition, media deals | Ops, Employee benefits | Media deals, player sales | Rev: 143, Op Loss: (7) (GBP) |
| Arista | Tech (Networking) | Product, Service | Datacenter high-perf demand | R&D, Sales, Dev | Cloud growth | Rev: 1,800, NI: 700 |
| Palo Alto | Tech (Security) | Product, Subscription, Support | Recurring revenue, diff. | R&D, Sales & Marketing | Cybersecurity growth | Rev: 2,139, NI: 351 |
| Cloudflare | Tech (Infrastructure) | Cloud security, performance | Cloud service growth | Sales, R&D | Infrastructure demand | Rev: 430, Op Loss: (31) |
| Dynatrace | Tech (Software Int.) | Subscription, Service | Enterprise relations, sub model | Sales, R&D | Observability demand | Rev: 418, NI: 44 |
| The Trade Desk | Tech (AdTech) | Programmatic ad tech | Tech platform edge | Sales, R&D | Programmatic market growth | Rev: 628, NI: 94 |
| Paramount | Media (Entertainment) | Film, TV, DTC | Content library, streaming | Ops, Marketing | Digital transformation | Rev: 6,700, NI: 100 |
| AMC | Entertainment (Theater) | Admissions, F&B | Box office revenue | Ops, Theater maintenance | Content slate, attendance | Rev: 1,349, Net Loss: (21) |
| Elastic | Tech (Analytics) | Subscription, Service | Retention, sub model | R&D, Sales & Marketing | Data analytics demand | Rev: 365, Op Loss: (4) |
| Snowflake | Tech (Cloud Data) | Product rev, Prof. services | Warehouse revenue, growth | R&D, Sales & Marketing | Cloud solution adoption | Rev: 942, Op Loss: (365) |
| DraftKings | Gaming (Betting) | Online gaming, Other | User engagement, handle | Sales, Technology | Sports betting expansion | Rev: 1,095, Op Loss: (299) |
| Alibaba | Tech (E-com/Cloud) | Taobao/Tmall, Int'l, Cloud | Revenue diversity, dominance | R&D, Marketing, Infra | E-com/Cloud/Digital Media | Rev: 3,370, NI: 620 (RMB 100M) |
| JD.com | Tech (E-commerce) | Retail, Logistics, New biz | Logistics edge, platform | Ops, Transport, Fulfillment | E-com growth, efficiency | Rev: 3,710, NI: 180 (RMB 100M) |
| Sea Ltd | Tech (Multi-service) | Shopee, Garena, SeaMoney | E-com growth, digital games | Sales, R&D | SE Asia expansion | Rev: 4,300, Op Profit: 200 |
| MercadoLibre | Tech (E-commerce) | E-com, Pago, Credit | E-com & digital payment growth | Sales, R&D | LatAm market growth | Consolidated NI not provided |
| Hims & Hers | Tech (Health) | Online subs, Wholesale | DTC subscription model | Marketing, Ops | Telehealth adoption | Rev: 402, NI: 76 |
| Zoom | Tech (Communication) | Enterprise, Online | Scalable tech, user growth | R&D, Sales & Marketing | Online collaboration growth | Rev: 1,178, NI: 207 |
| Procore | Tech (Construction SW) | Construction mgmt solutions | Digital construction demand | Sales, R&D | Industry software adoption | Rev: 296, Op Loss: (36) |
| Digital Ocean | Tech (Infrastructure) | Cloud infra (Global) | Developer usage | R&D, Sales | Developer cloud demand | Rev: 1,178, NI: 207 |
| Semrush | Tech (Digital Mktg) | SEO & Marketing services | Service growth, globalization | R&D, Sales | Digital transformation demand | Rev: 97, NI: 1 |
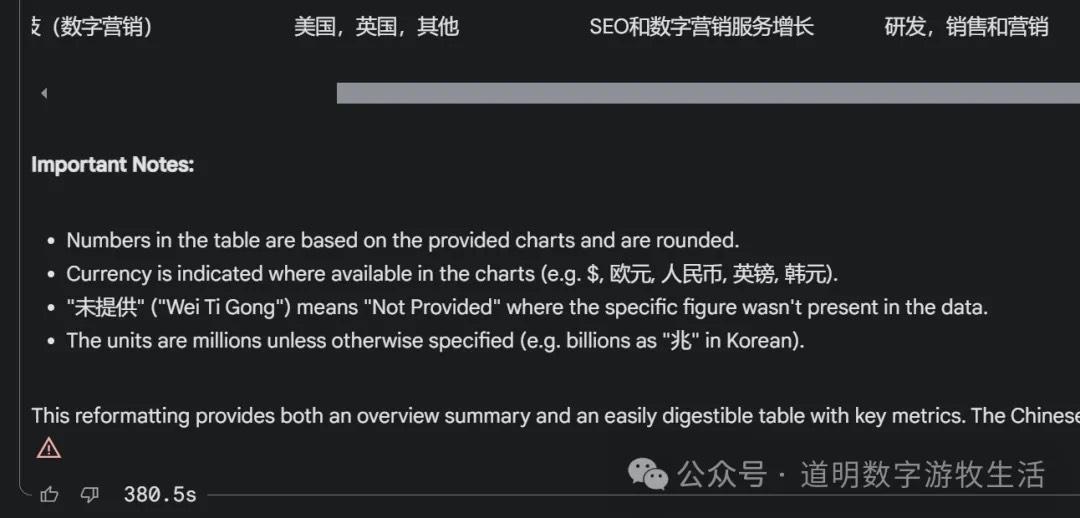
Important Notes:
- Numbers in the table are based on the provided charts and are rounded.
- Currencies are indicated where available (e.g., $, EUR, RMB, GBP, KRW).
- "Not Provided" indicates the specific figure was not present in the dataset.
- Units are in millions unless otherwise specified (except for KRW).