Task: Analyze Market Performance Trends for INOD and Related Industry Indices/Competitors Over the Past Five Years.
Comprehensive financial report on the performance of Innodata Inc. (NASDAQ: INOD).
Innodata Inc. (NASDAQ: INOD) is a digital services and solutions company that provides technology and services focused on artificial intelligence (AI) platforms, data engineering, and content transformation. It belongs to the technology industry, specifically within the EDP (Electronic Data Processing) services sector.
To analyze Innodata's market performance trends over the past five years (September 2020 to September 2025), its historical stock price data can be compared with relevant industry indices and key competitors.
Historical Stock Performance (Sept 2020 - Sept 2025)
The following provides a summary of performance trends and total returns during this period.
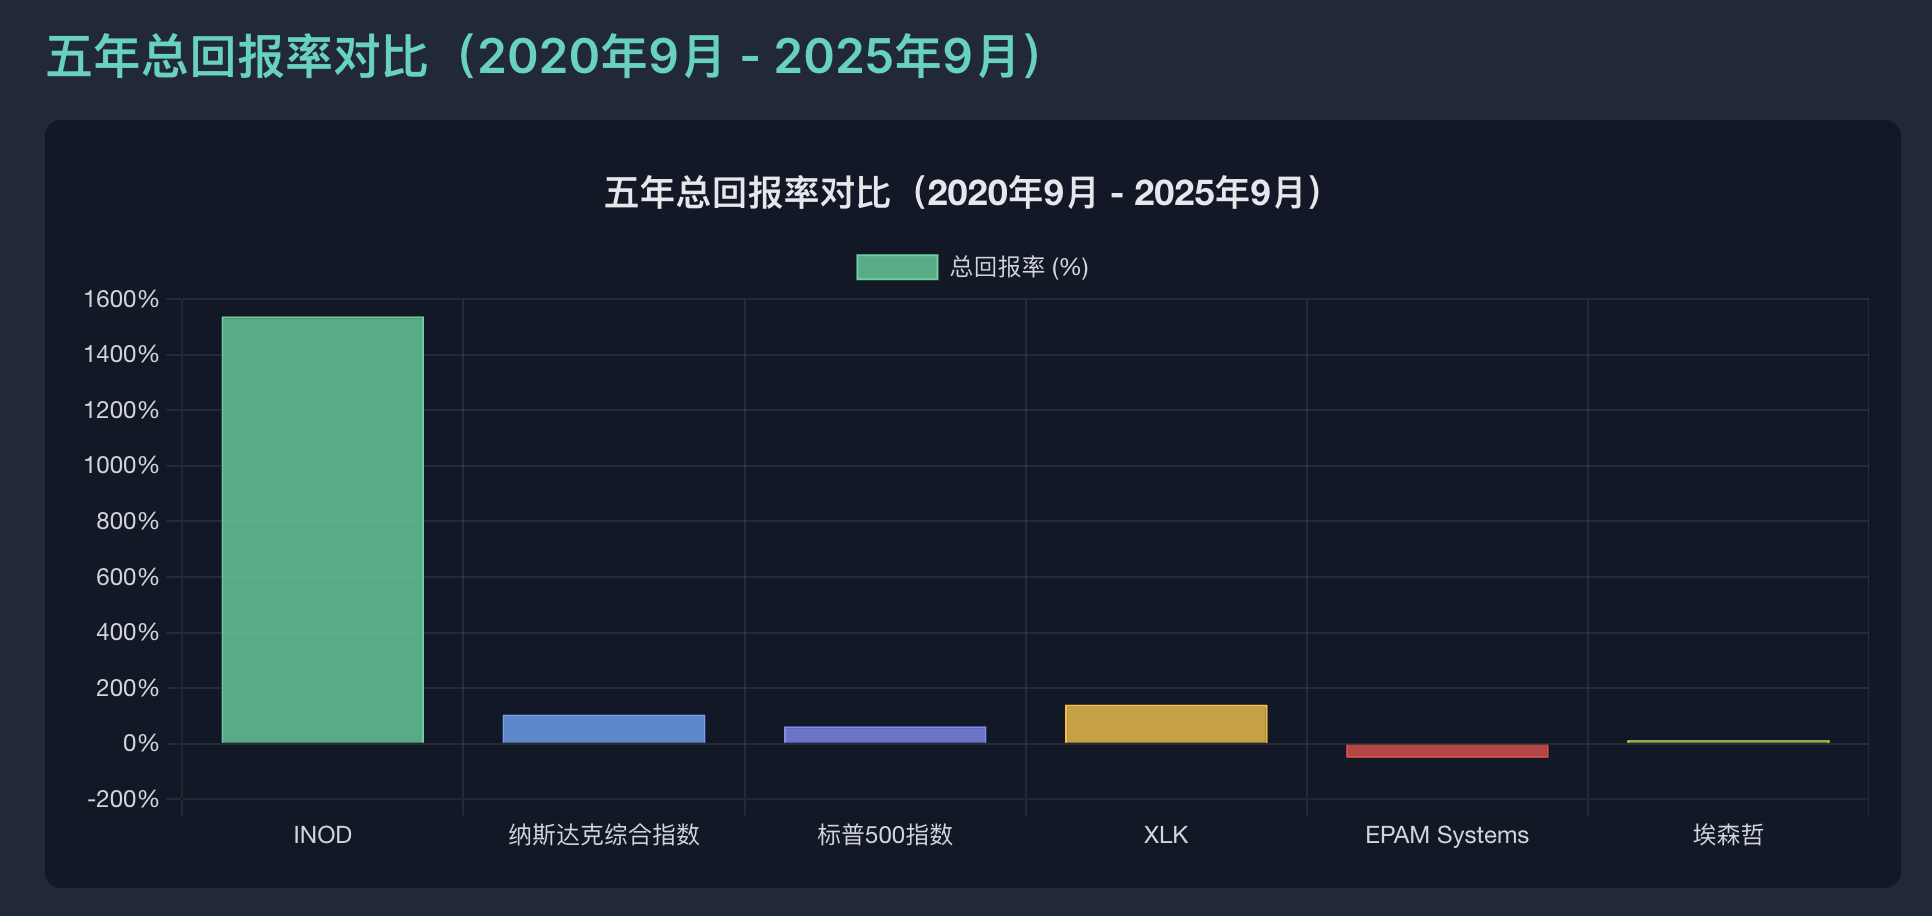
Five-Year Total Return Comparison
1. Innodata Inc. (INOD)
Innodata Inc. has shown exceptionally strong performance over the last five years. The five-year total return is approximately 1,537.45%. This means an investment of $1,000 in INOD five years ago would now be worth approximately $16,374.47.
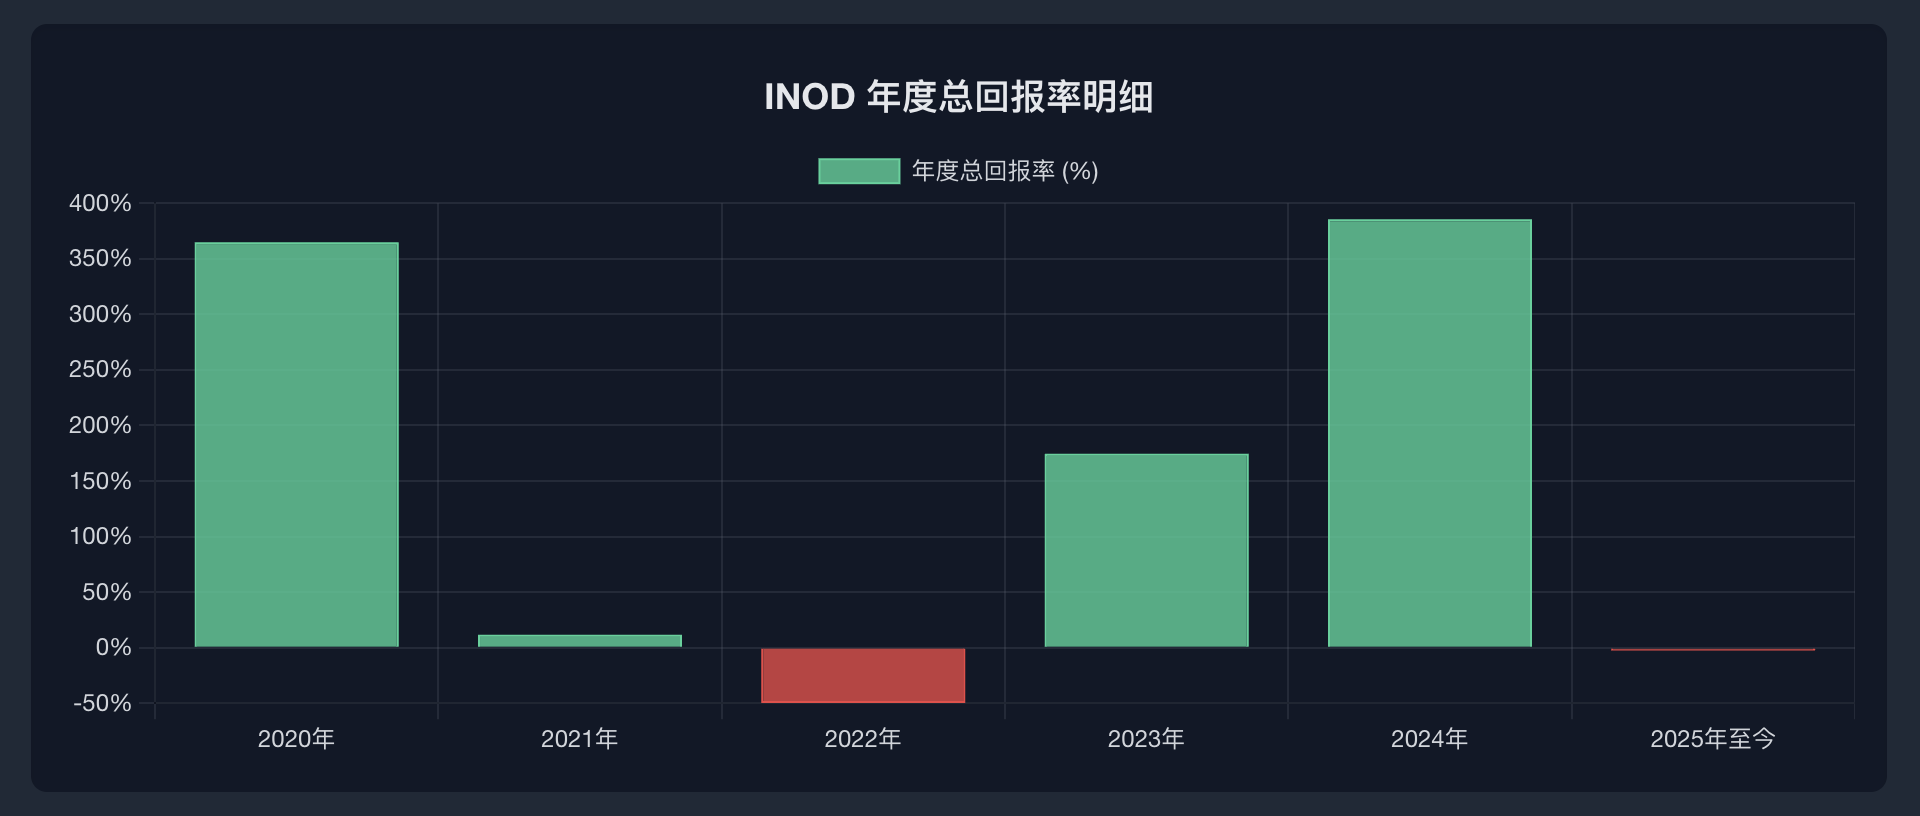
Annual Performance Breakdown:
- 2020: +364.91%
- 2021: +11.70%
- 2022: -49.92%
- 2023: +174.54%
- 2024: +385.50%
- 2025 YTD: -2.63% (as of reference data)
This reflects significant volatility, with massive growth periods in 2020, 2023, and 2024. Innodata's recent performance is heavily influenced by its focus on AI data services.
2. Related Industry Indices
- Nasdaq Composite (IXIC): Five-year total return of approx. +104.00%. Heavily weighted toward tech, this is a strong benchmark for INOD.
- S&P 500 Index (SPX): Five-year total return of approx. 61.7%.
- Technology Select Sector SPDR Fund (XLK): Five-year total return of approx. +139.80%.
3. Key Competitors
- EPAM Systems (EPAM): Five-year total return of approx. -51.13%. Performance is significantly weaker than general tech indices and Innodata.
- Accenture (ACN): Five-year total return of approx. +12.17%. Steady performance but significantly lags tech indices and Innodata.
Income Statement Trend Analysis
INOD has exhibited significant growth and profitability improvement over the past five fiscal years. Below is an analysis based on TTM (Trailing Twelve Months) data:
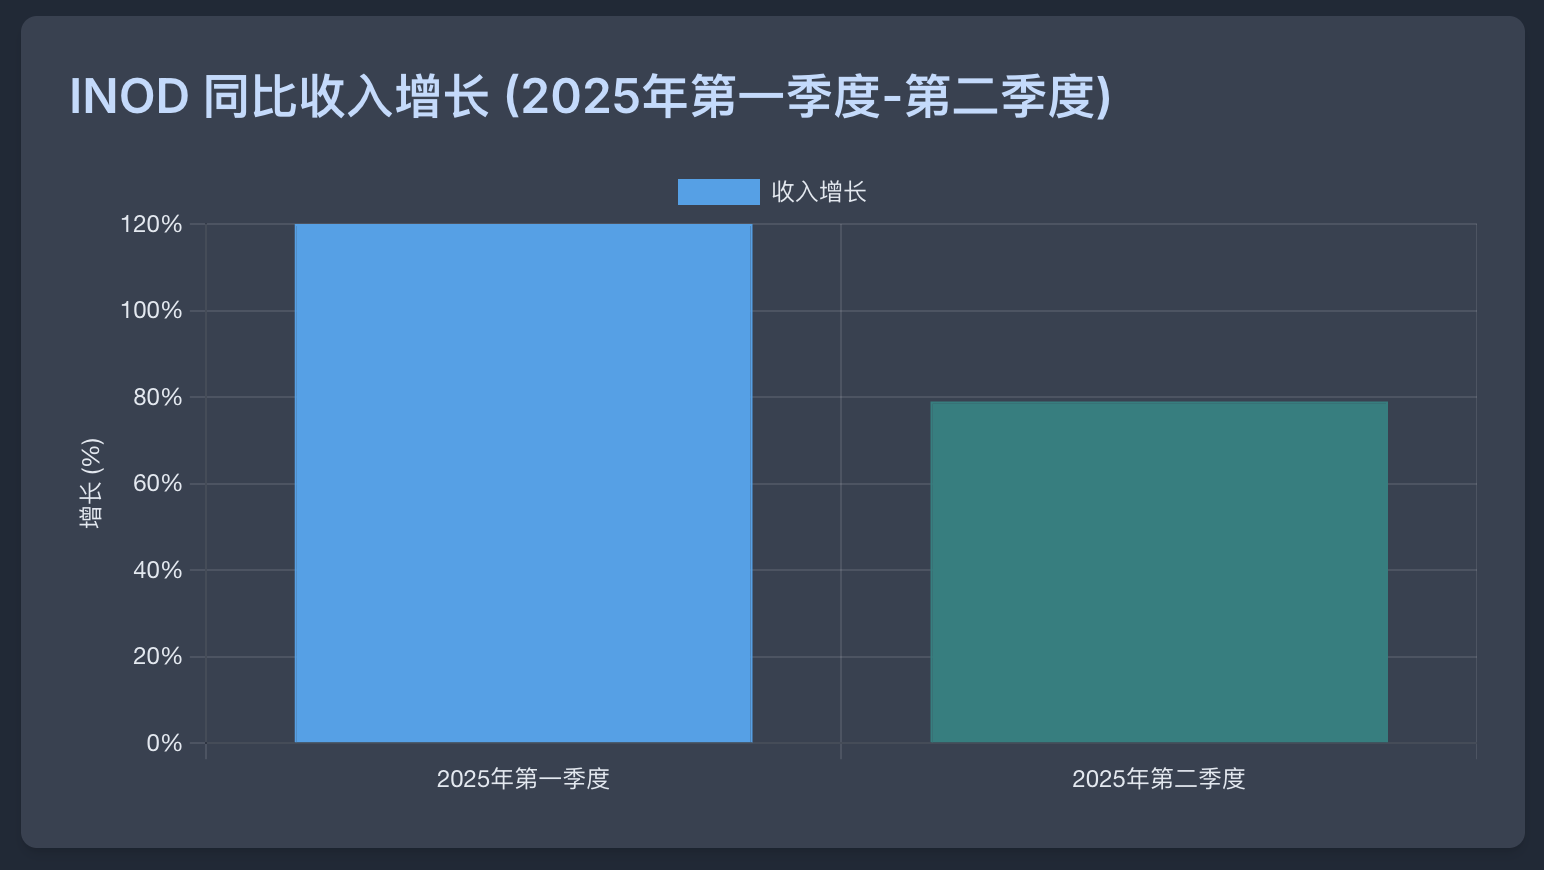
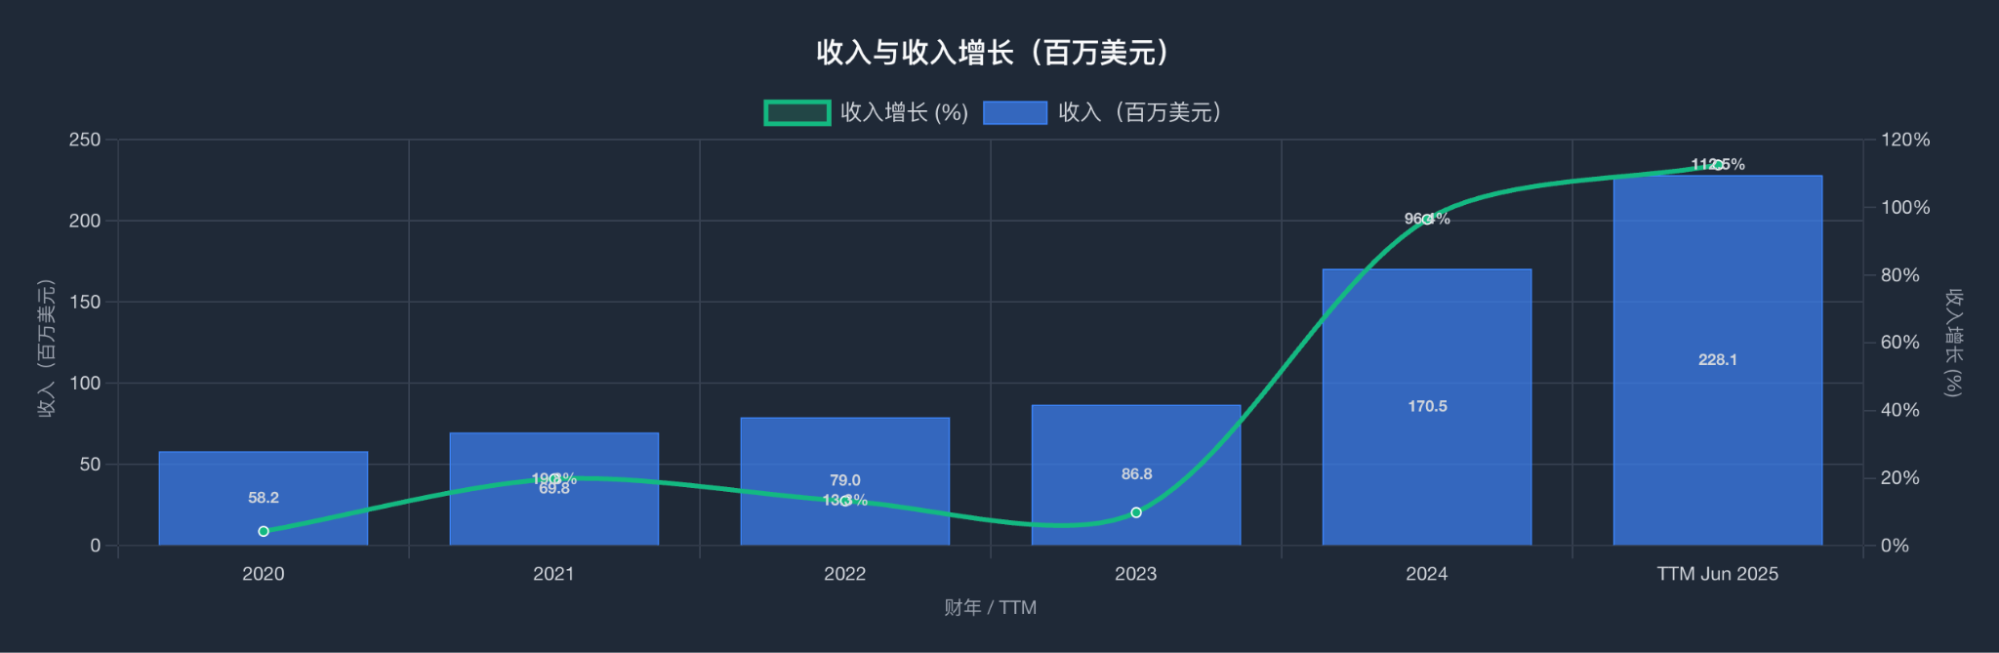
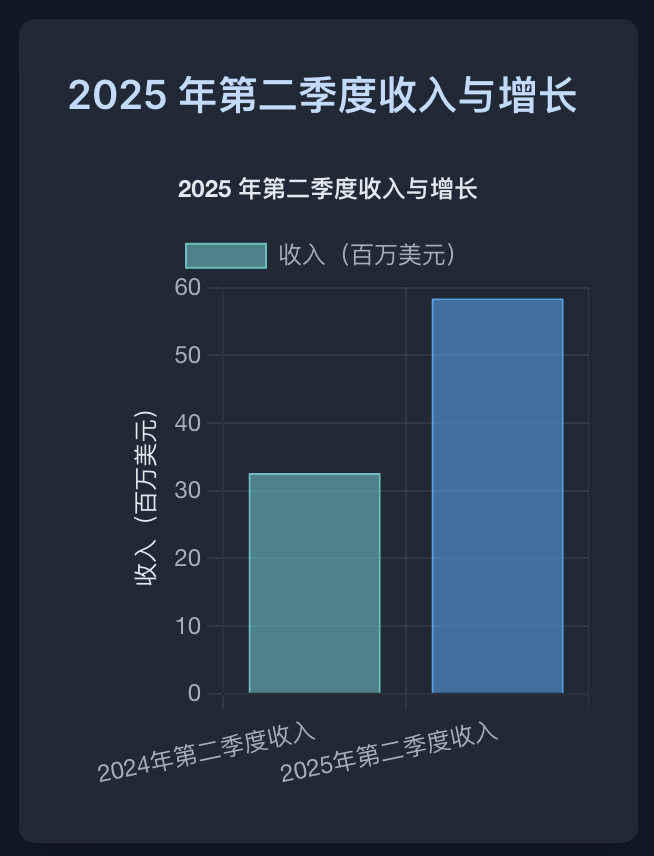
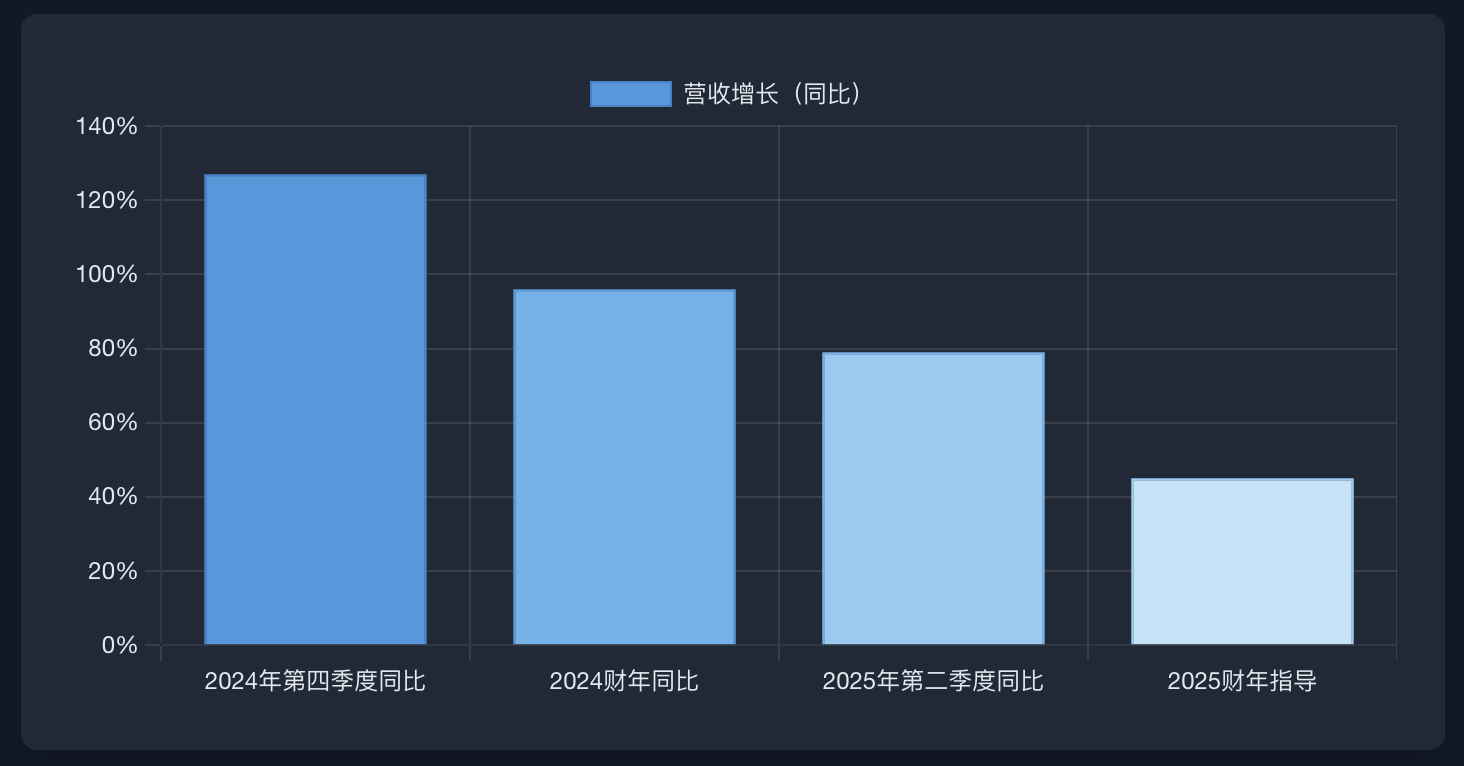
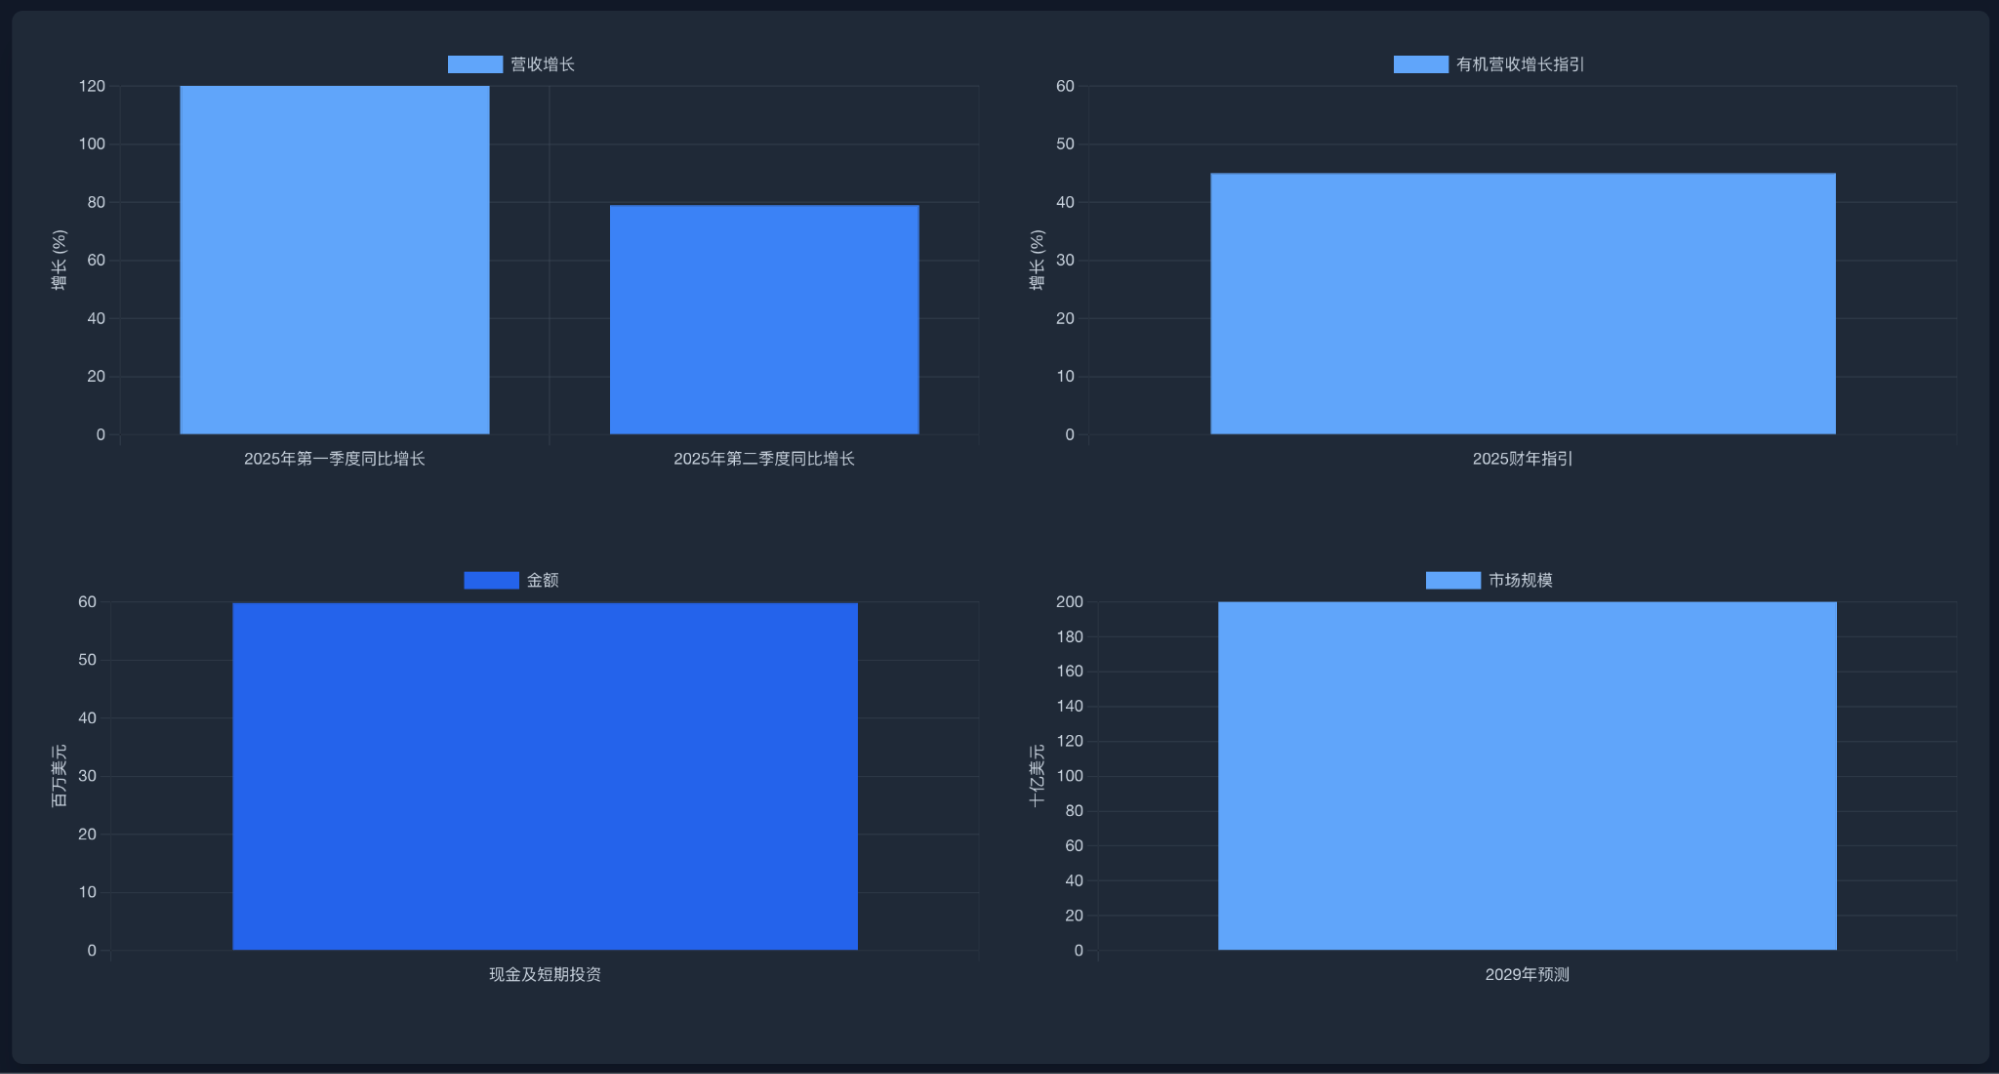
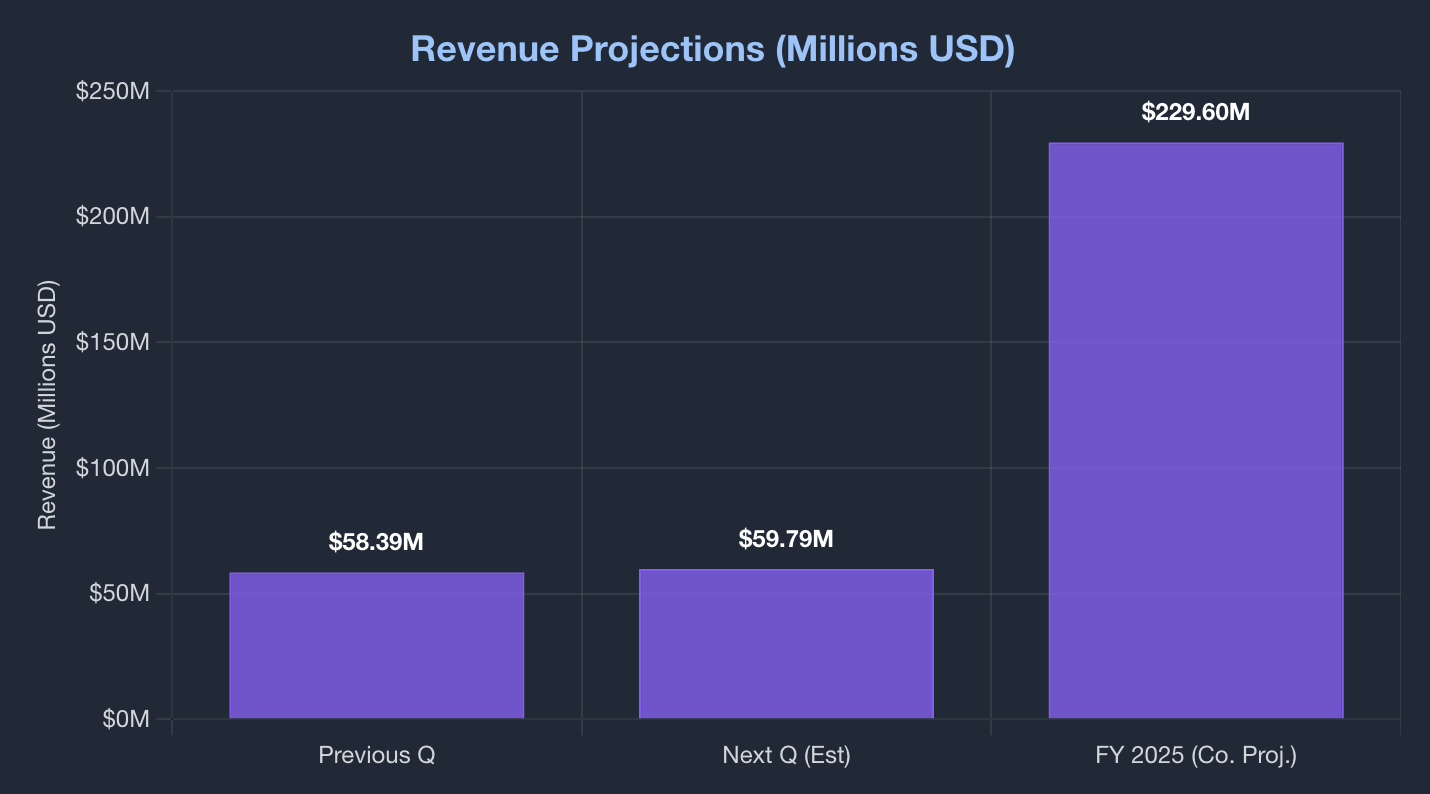
1. Revenue and Revenue Growth
Revenue grew from $58.24 million in 2020 to $170.46 million in 2024. As of June 2025 TTM, it reached $228.14 million, a year-over-year increase of 112.54%.
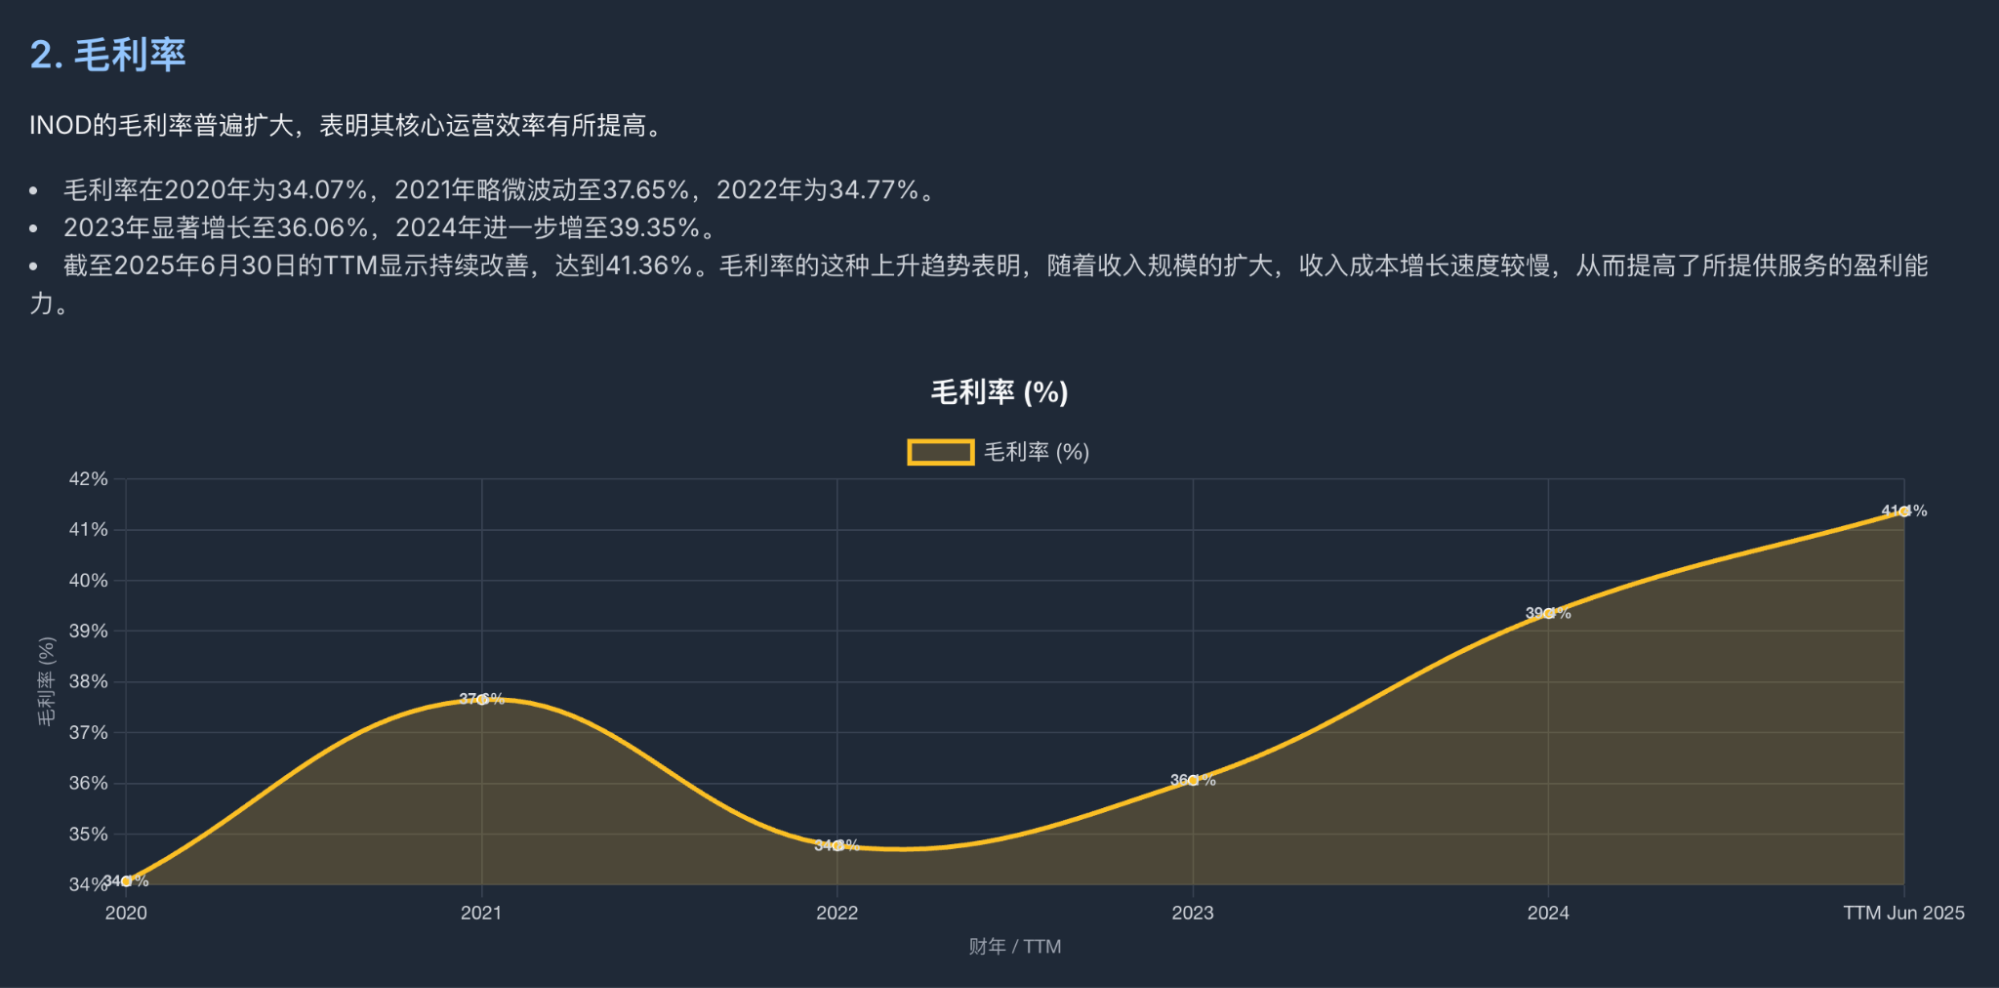
2. Gross Margin
Gross margins have expanded consistently, from 34.07% in 2020 to 41.36% for the June 2025 TTM.
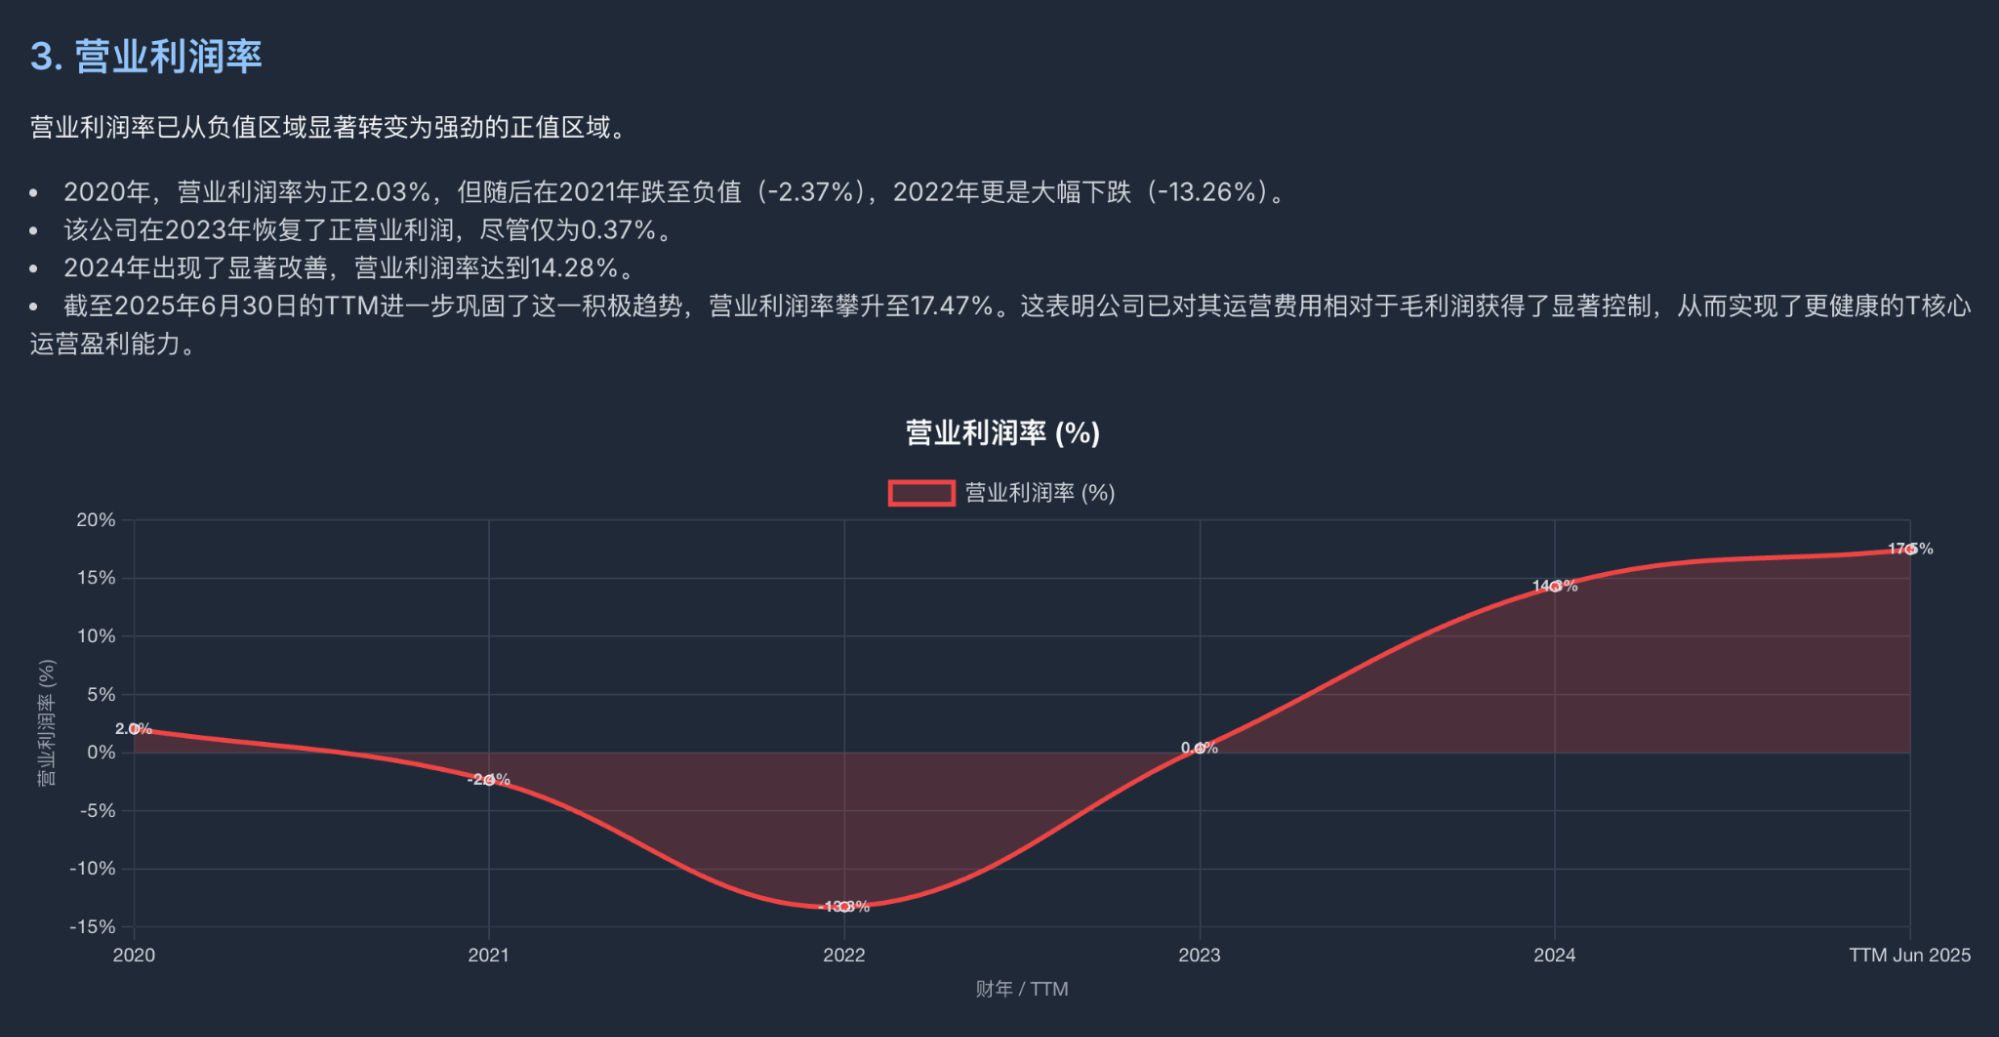
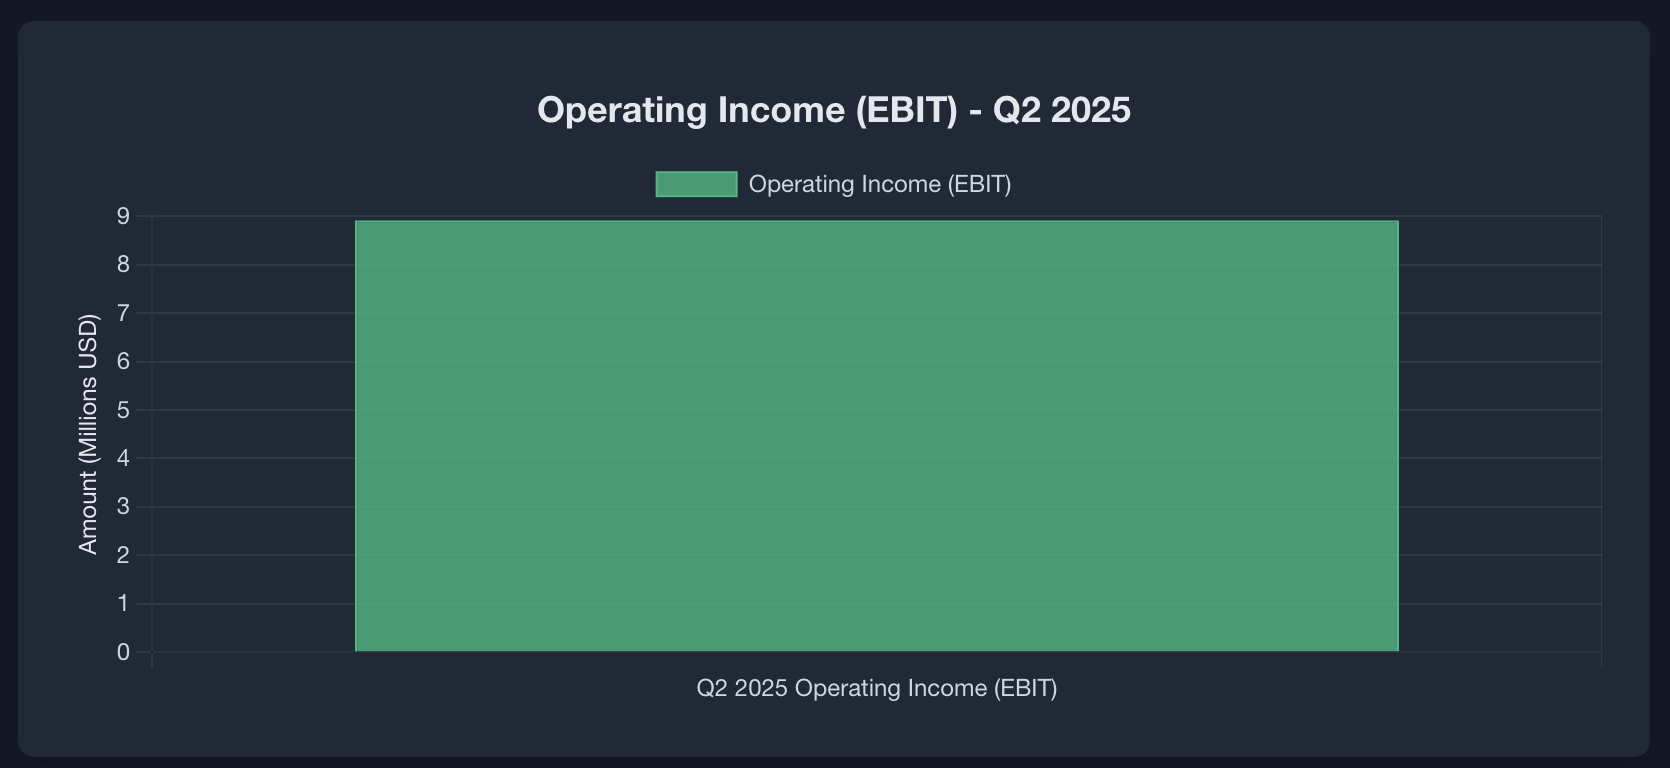
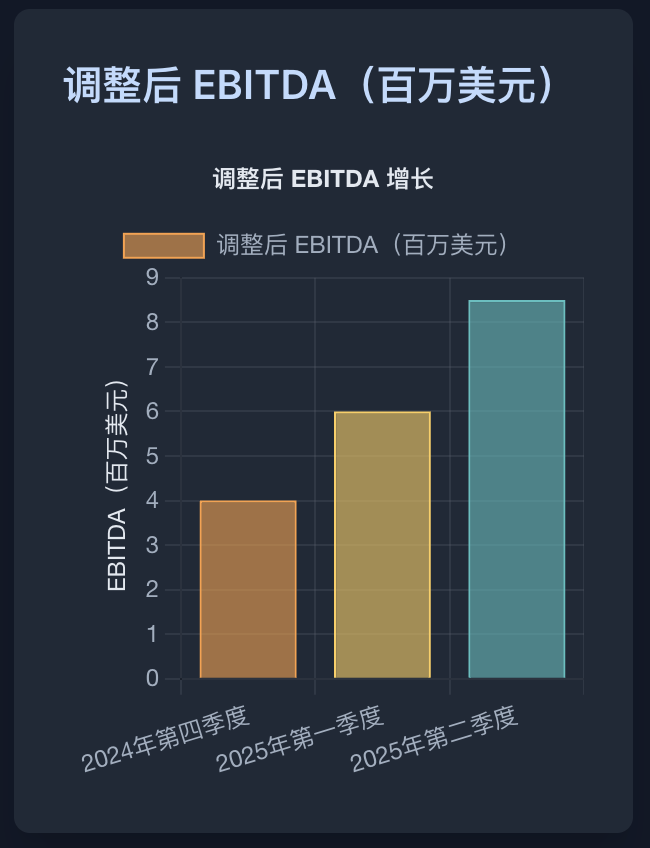
3. Operating Margin
Operating margins have shifted from negative to positive, climbing to 17.47% for the June 2025 TTM.
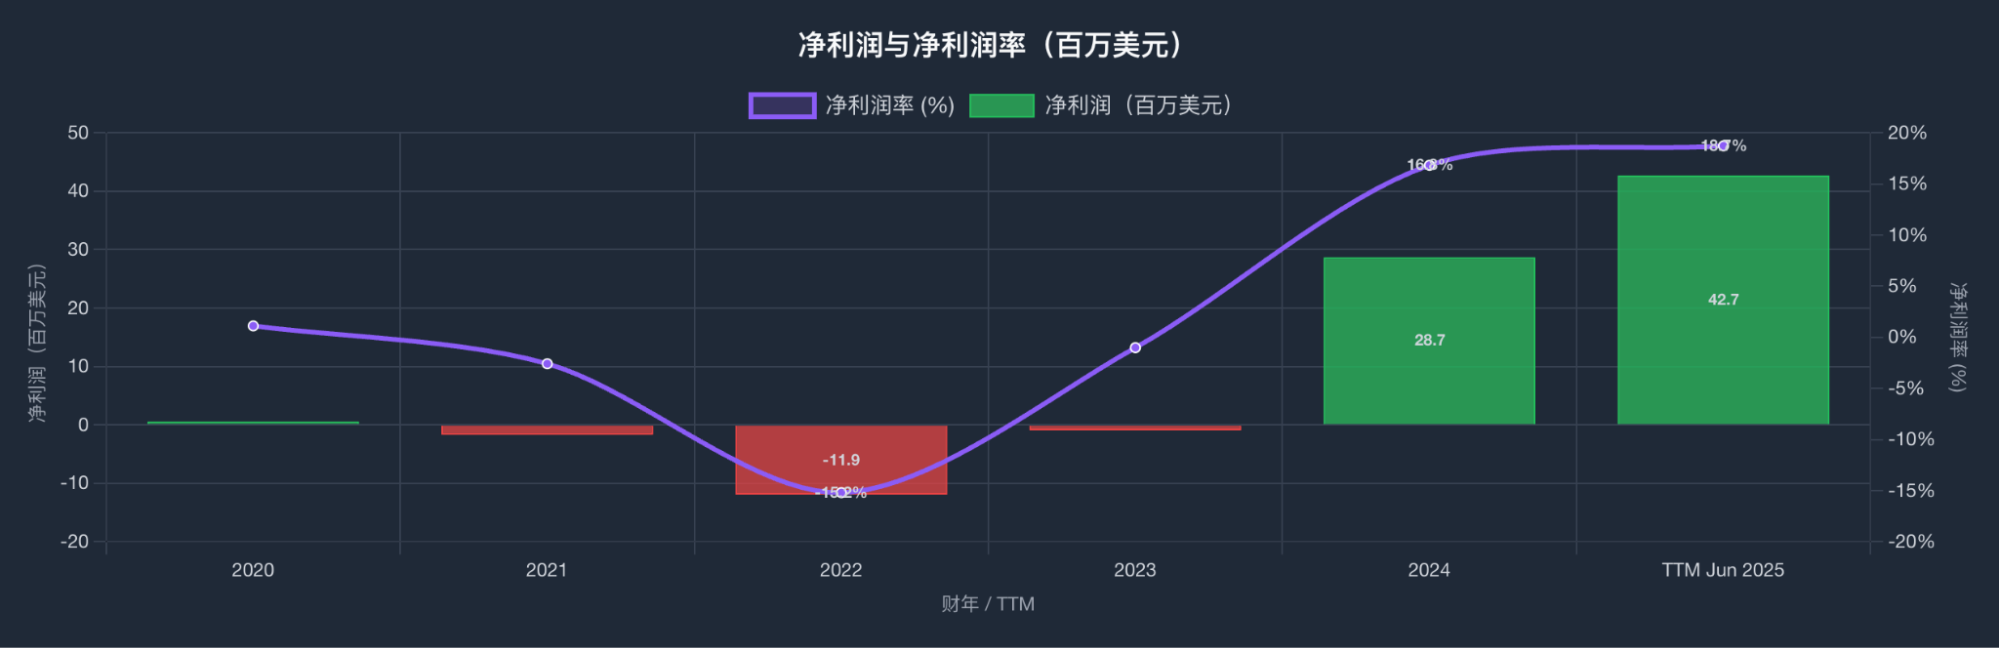
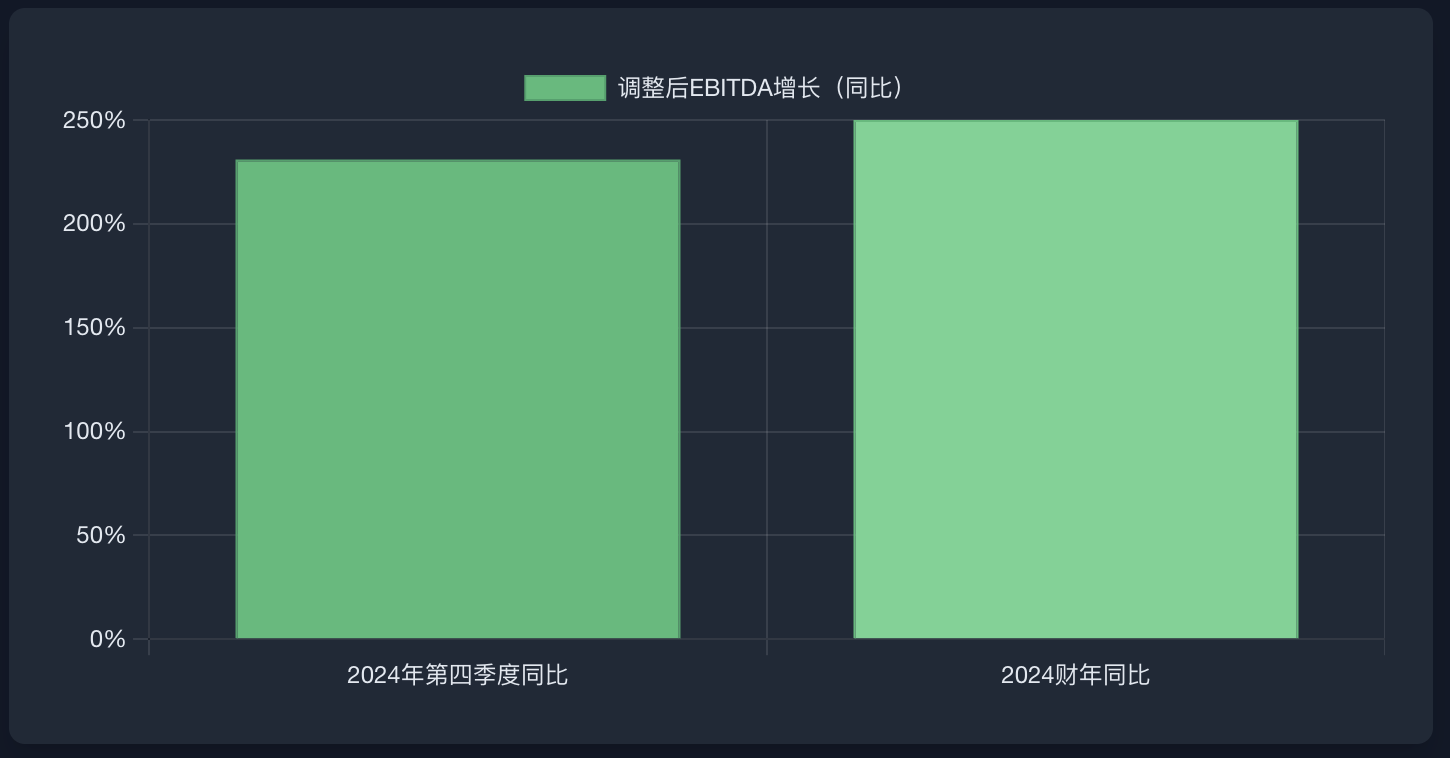
4. Net Income and Net Margin
2024 marked a strong turnaround with a net income of $28.66 million. Net income for the June 2025 TTM was $42.69 million, with a net margin of 18.72%.
Balance Sheet and Financial Position
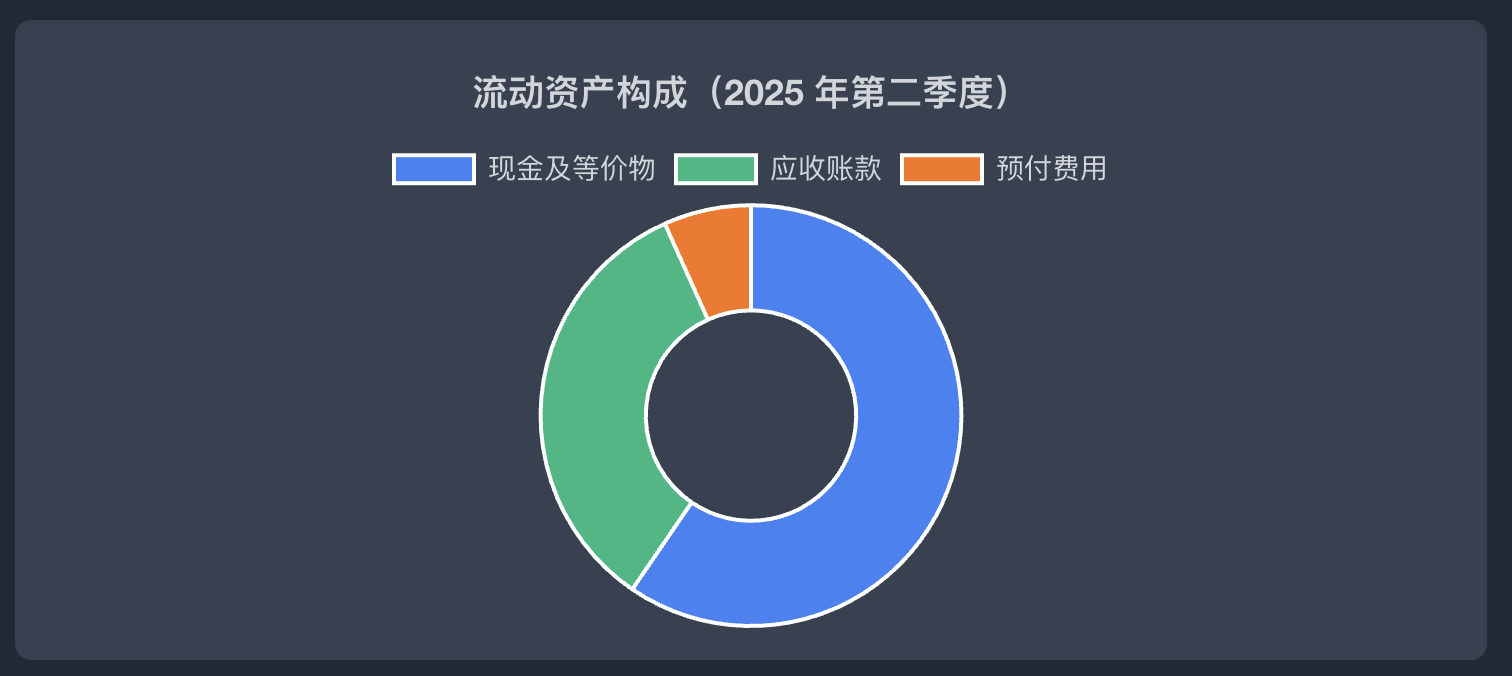
Asset Composition
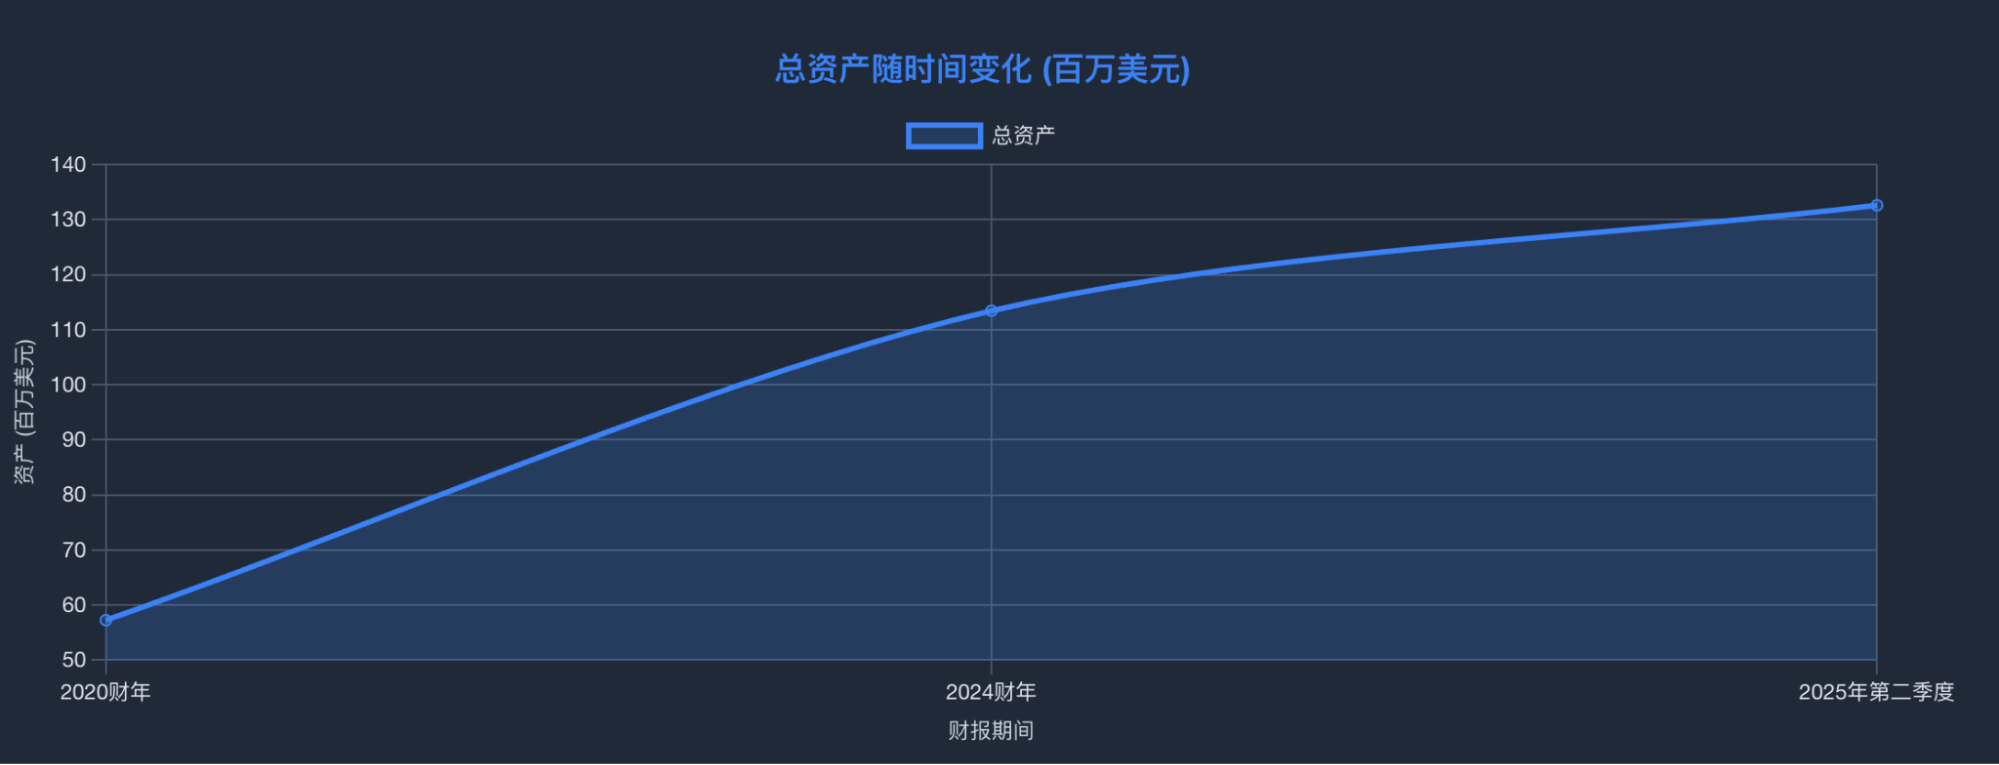
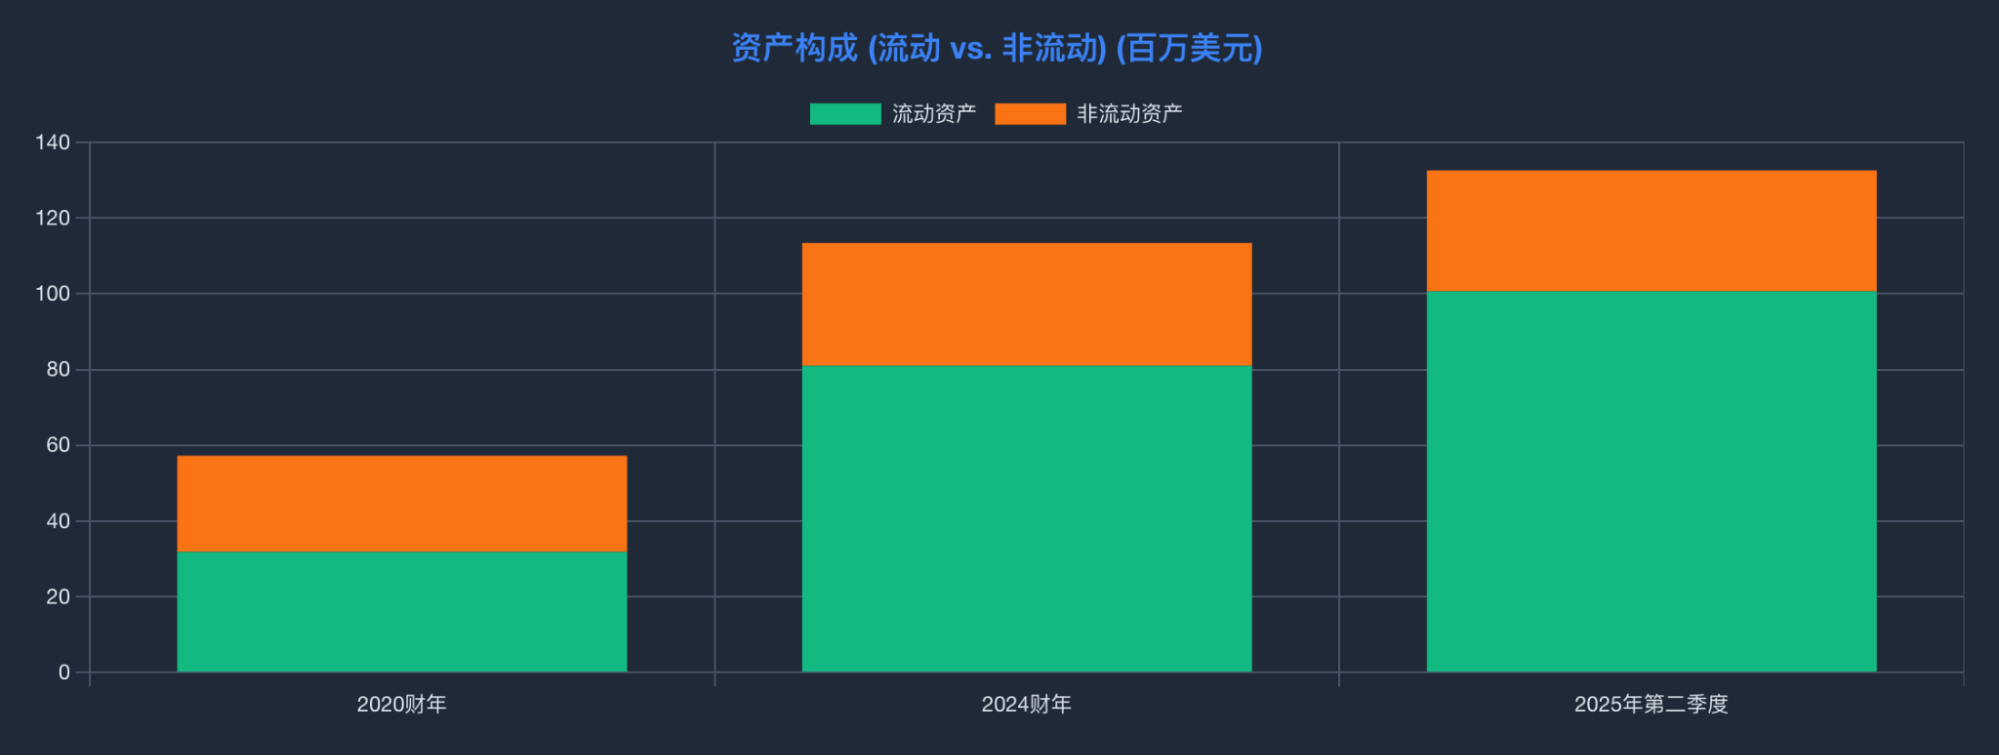
Total assets grew from $57.25 million in 2020 to $132.62 million in Q2 2025, primarily driven by current assets.
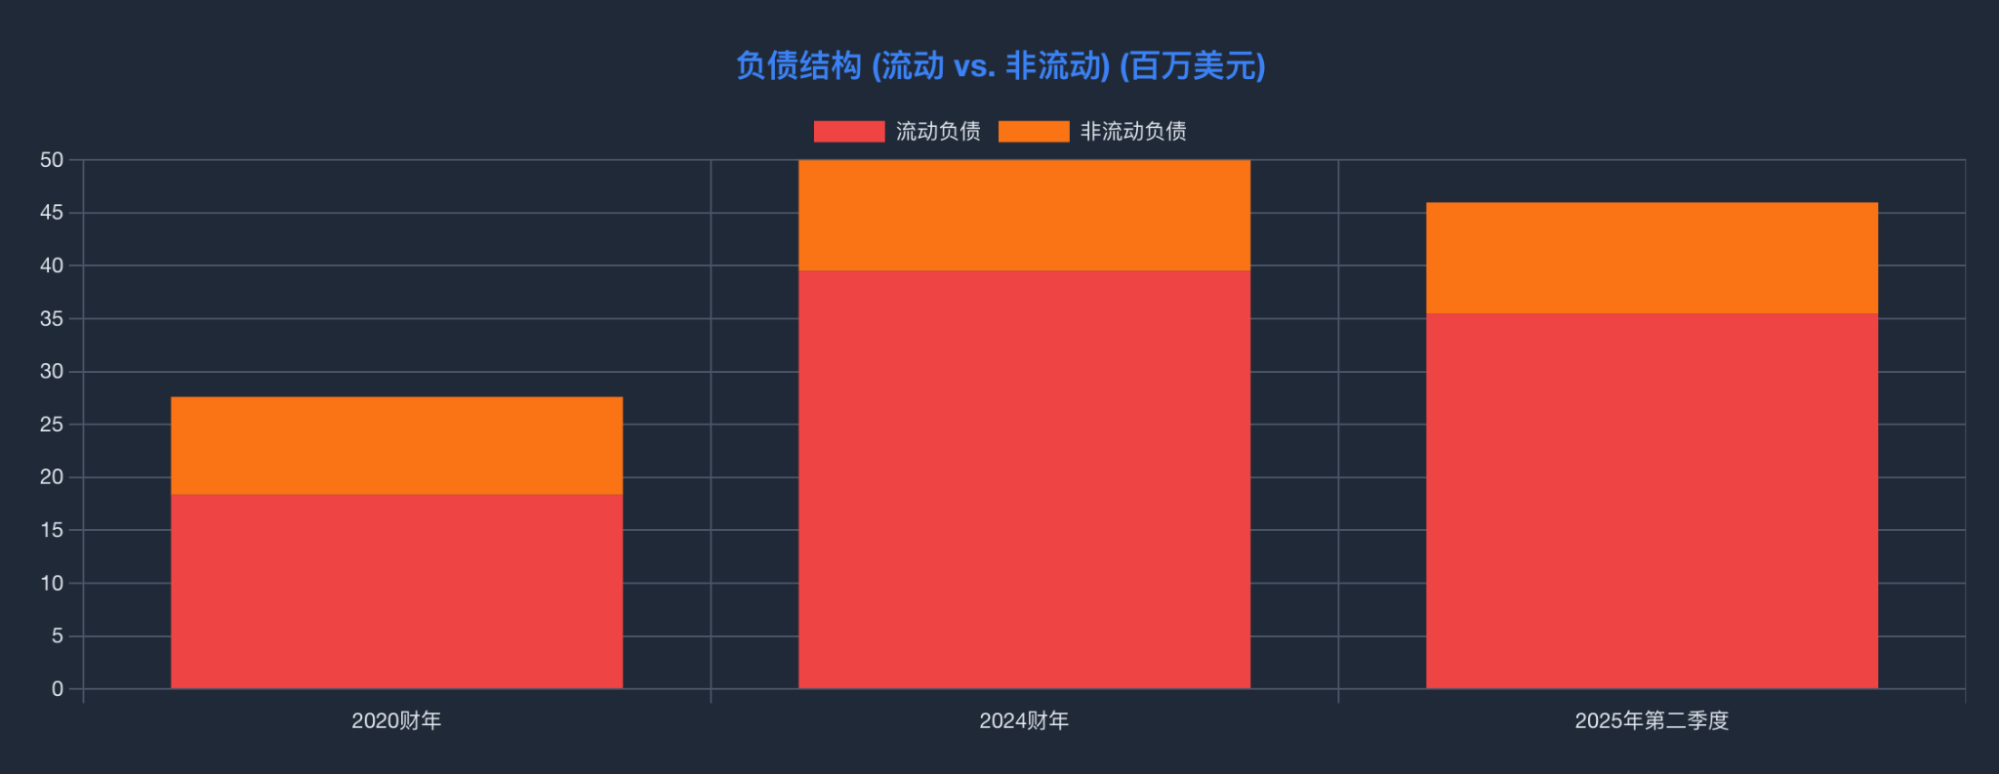
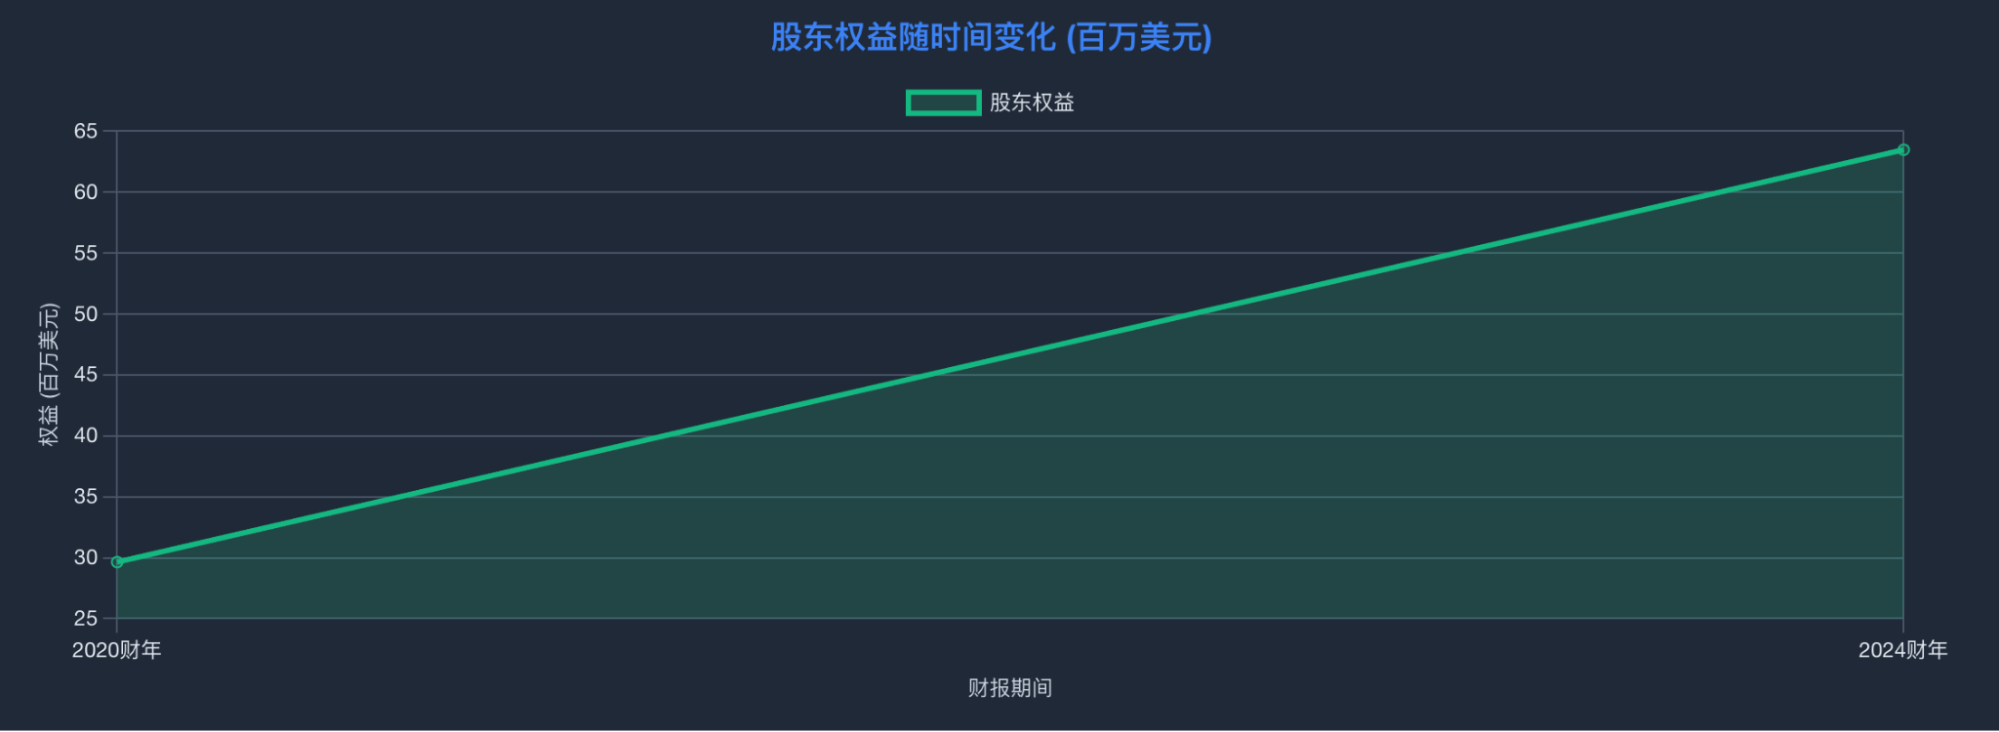
Liabilities and Equity
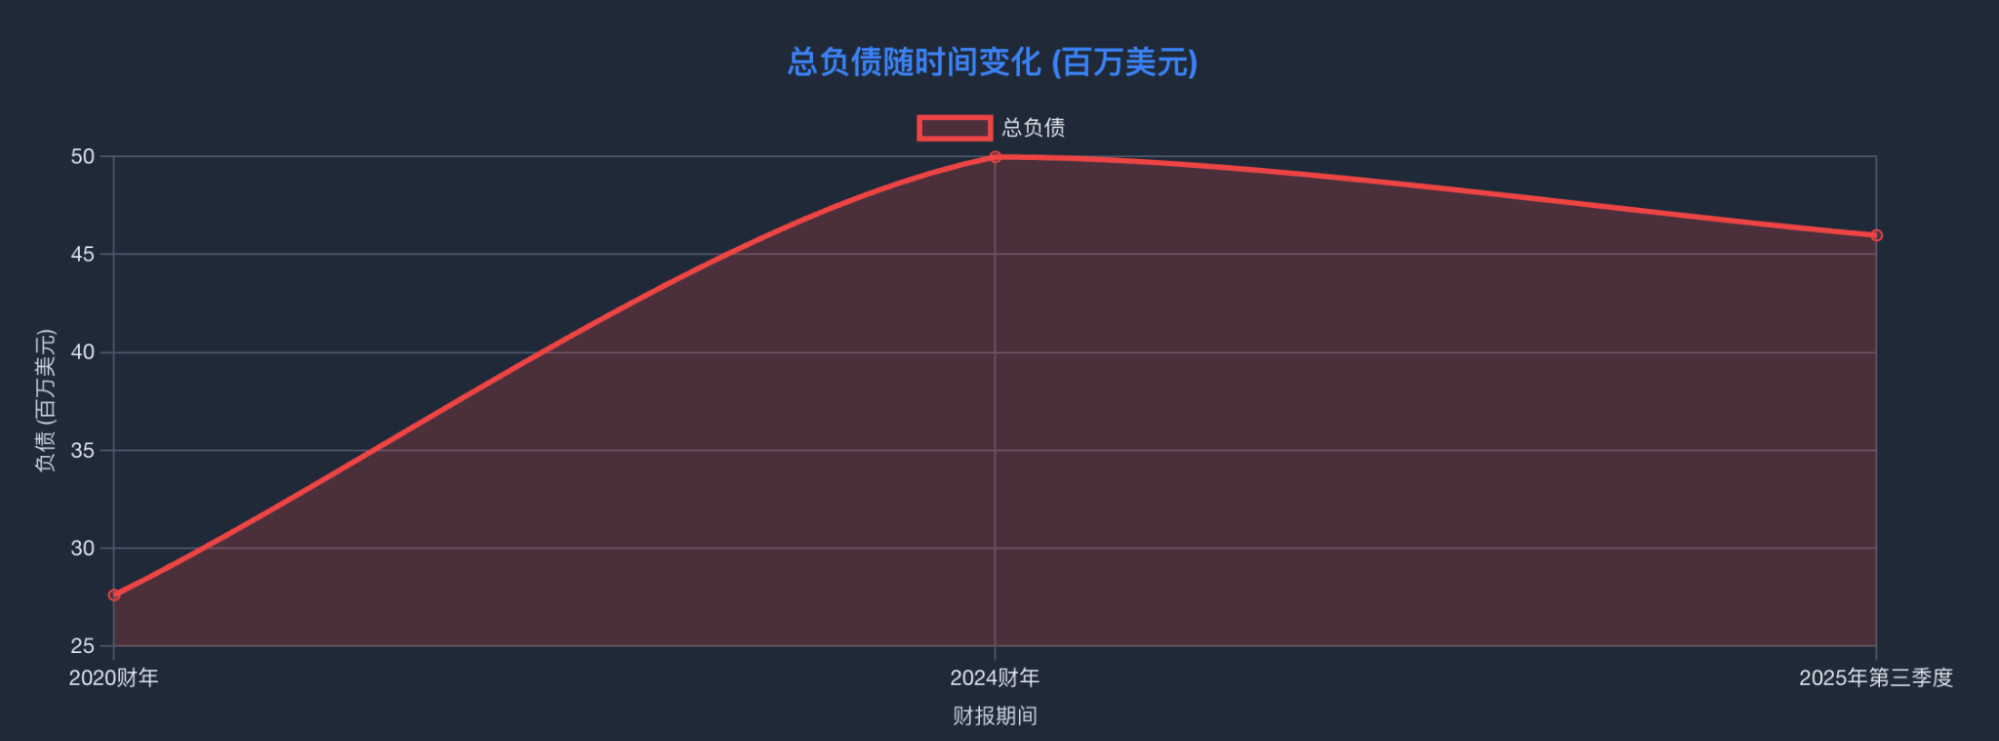
INOD maintains a low-debt policy, with several analysts highlighting a "debt-free" status. Shareholders' equity grew from $29.64 million in 2020 to $63.47 million in 2024.
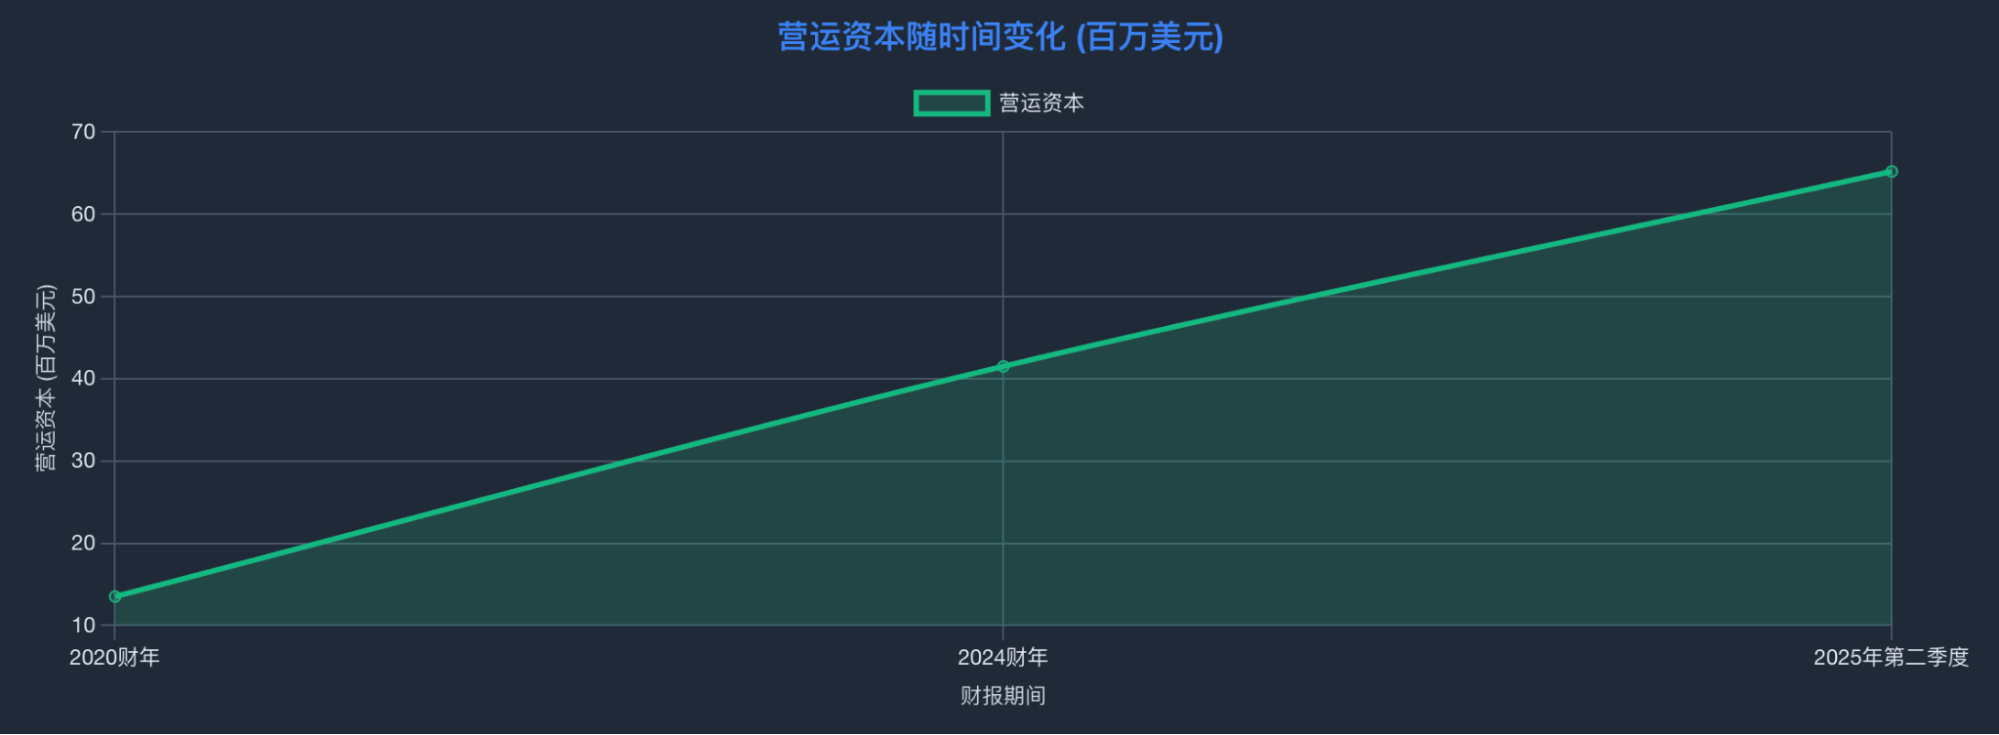
Working capital strengthened significantly to $65.19 million by Q2 2025.
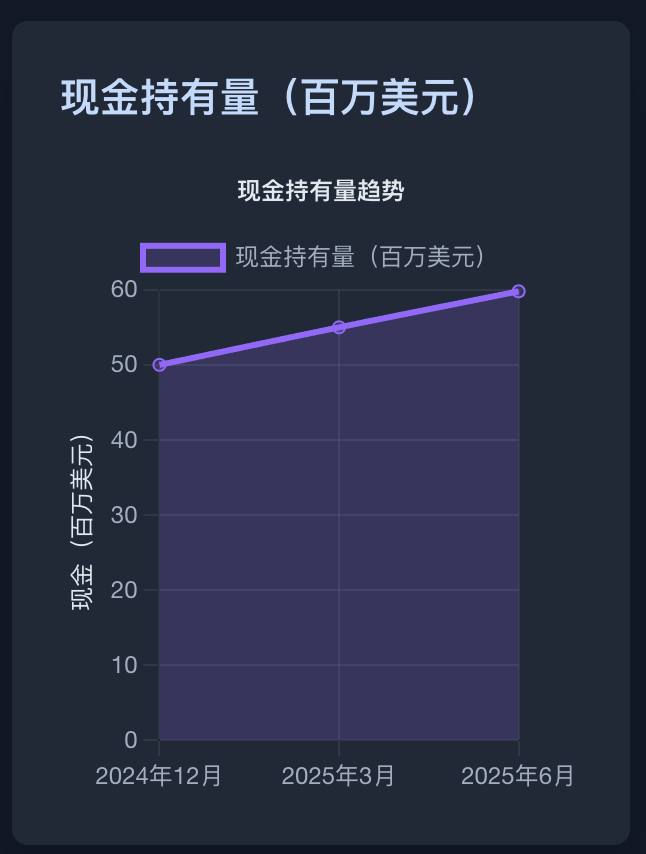
Cash Flow Analysis
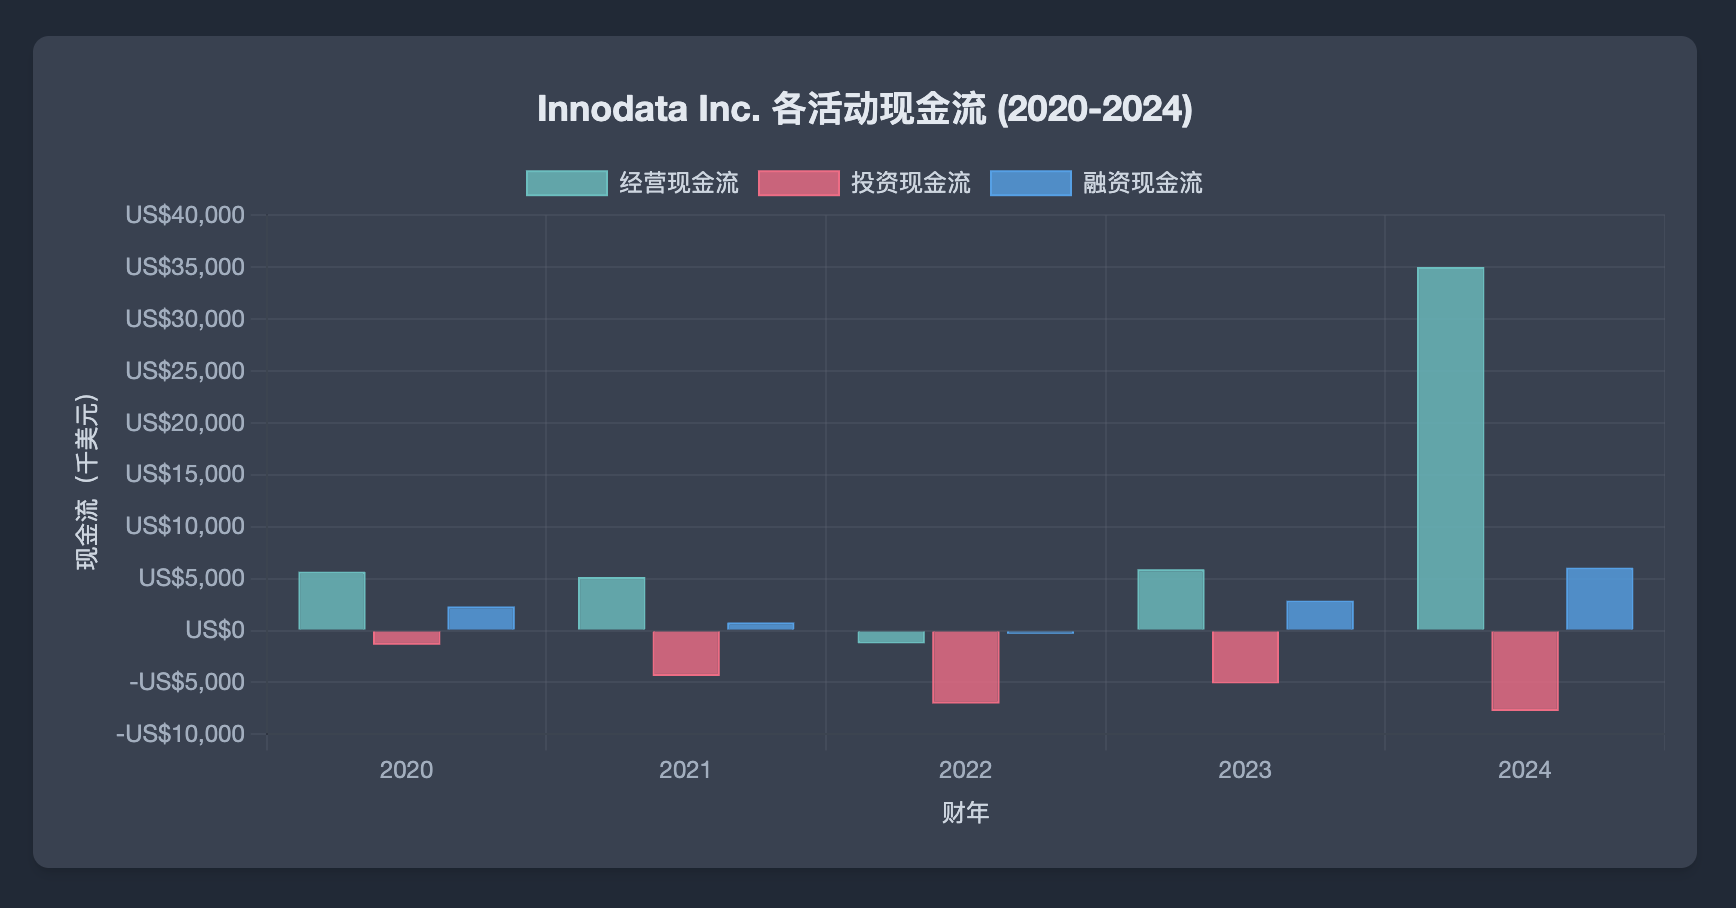
Operating cash flow soared to $35.015 million in 2024. Investing cash flows remain negative, reflecting ongoing technological and infrastructure expenditures. Financing activities primarily reflect reliance on equity financing.
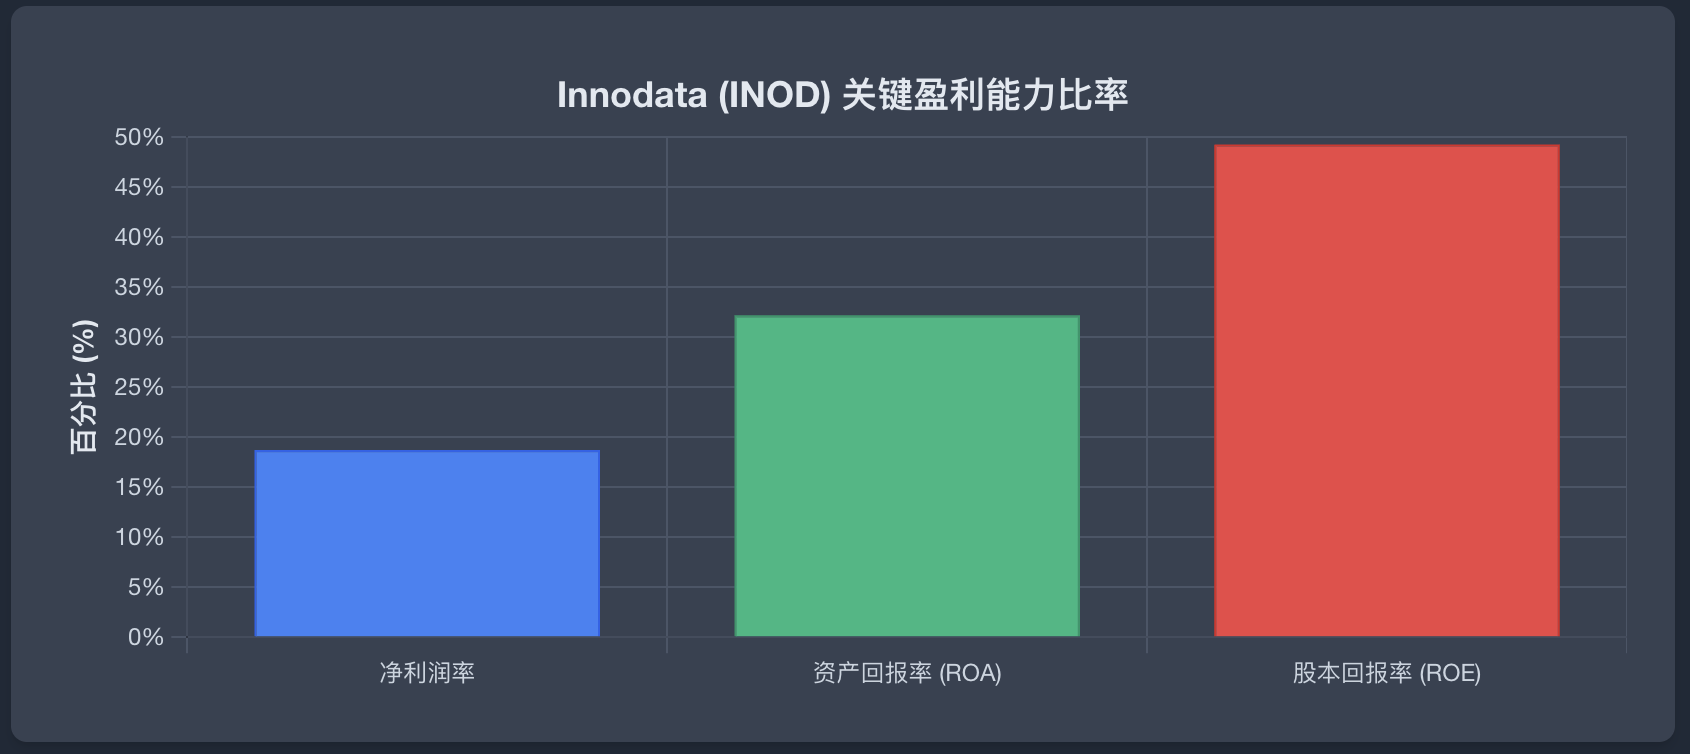
Profitability Ratios
As of June 2025:
- Net Profit Margin: 18.71%
- Return on Assets (ROA): 32.19%
- Return on Equity (ROE): 49.27%
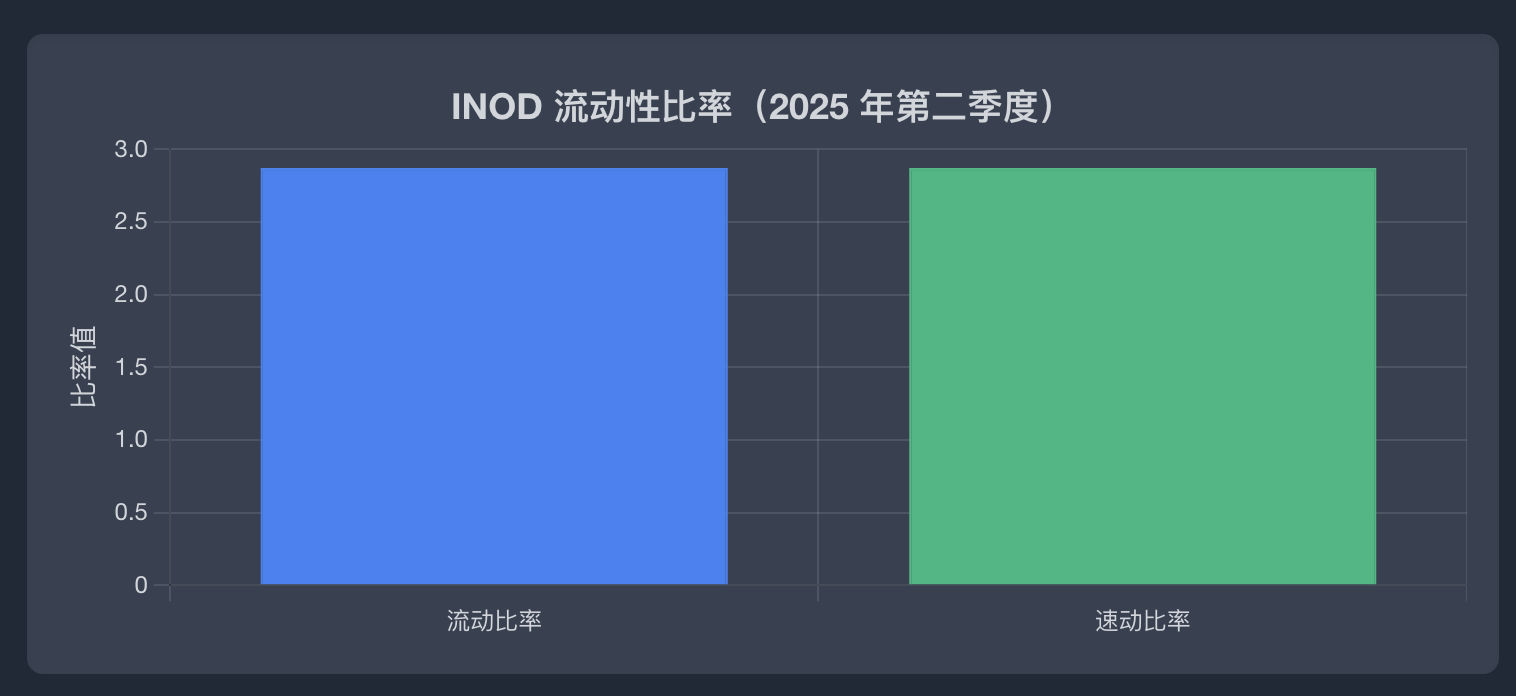
Financial Health and Solvency
Current and Quick ratios both stood at 2.87 as of Q2 2025, signaling very healthy liquidity.
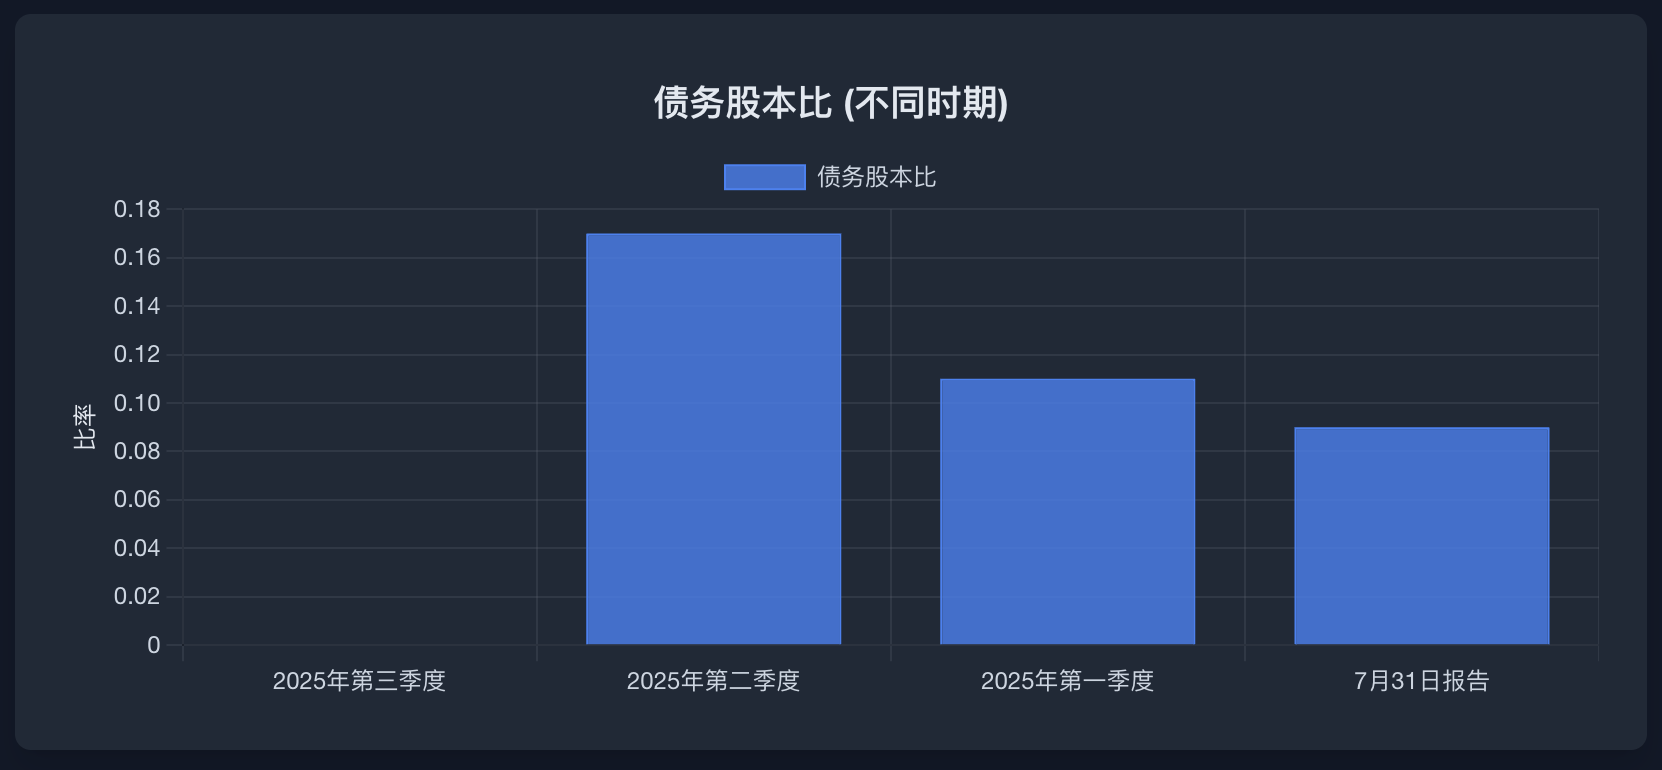
The debt-to-equity ratio is low at 0.17. With negligible interest expense, the interest coverage ratio is very high, indicating strong long-term stability.
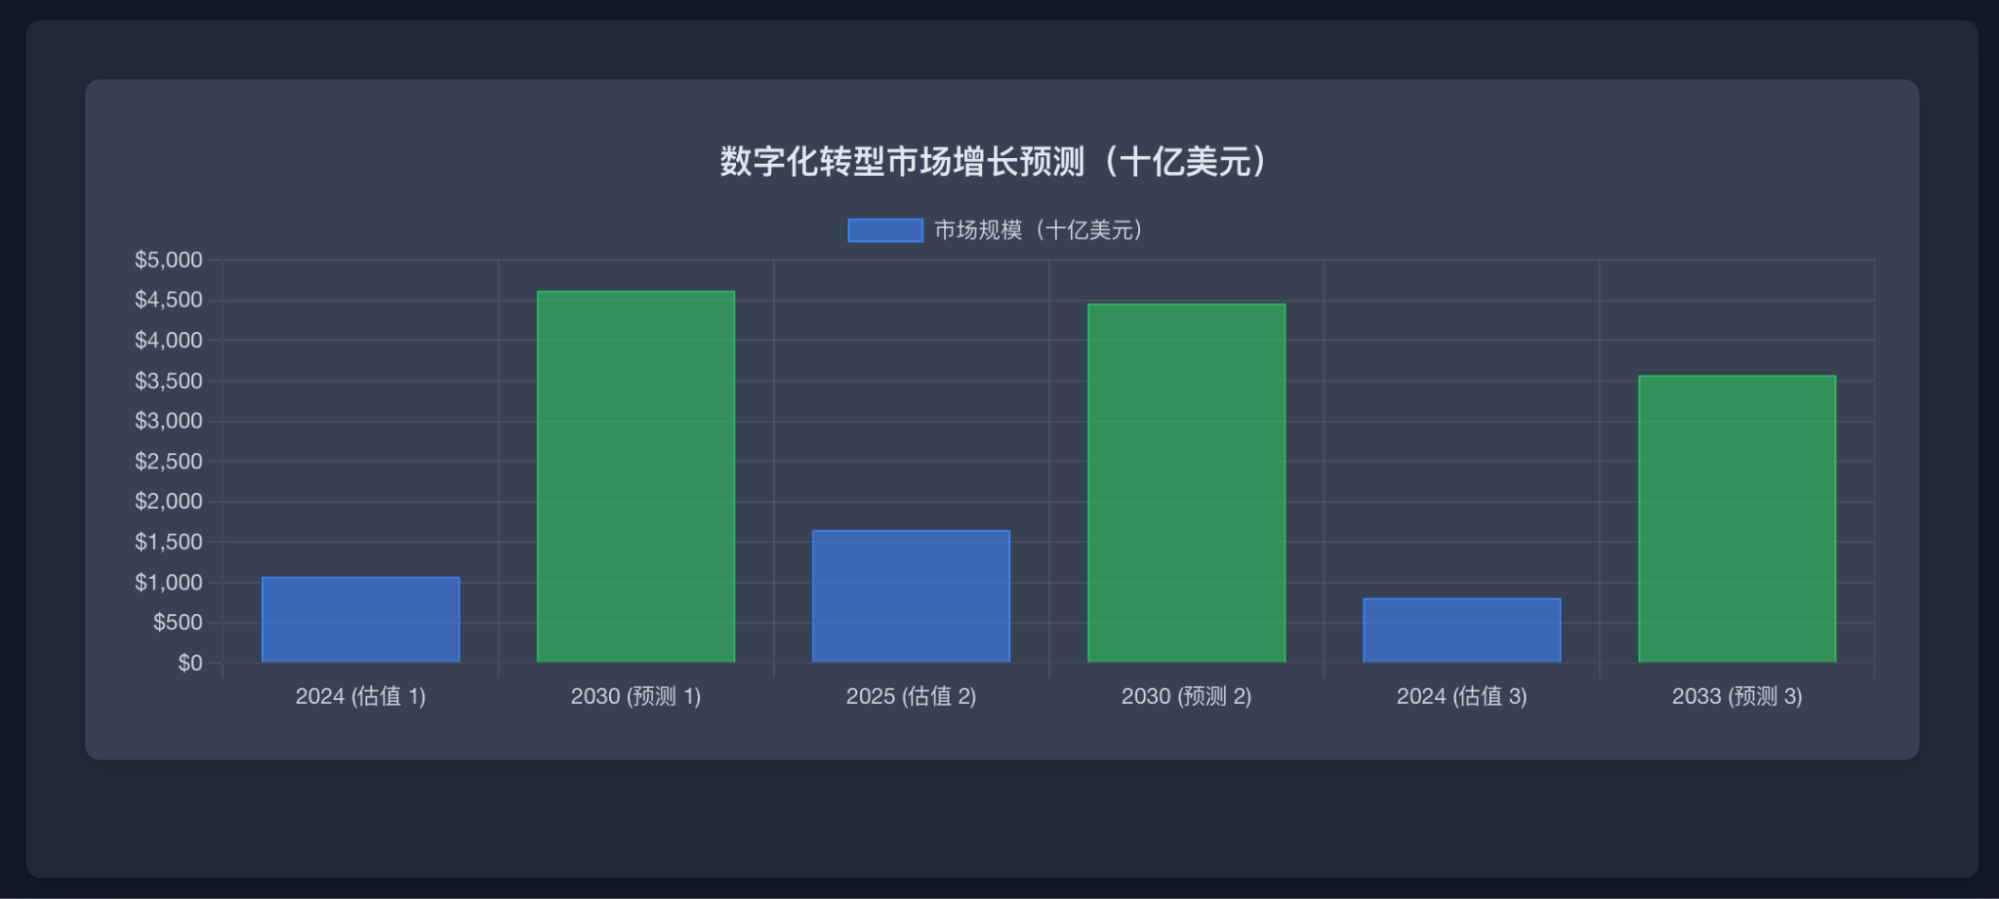
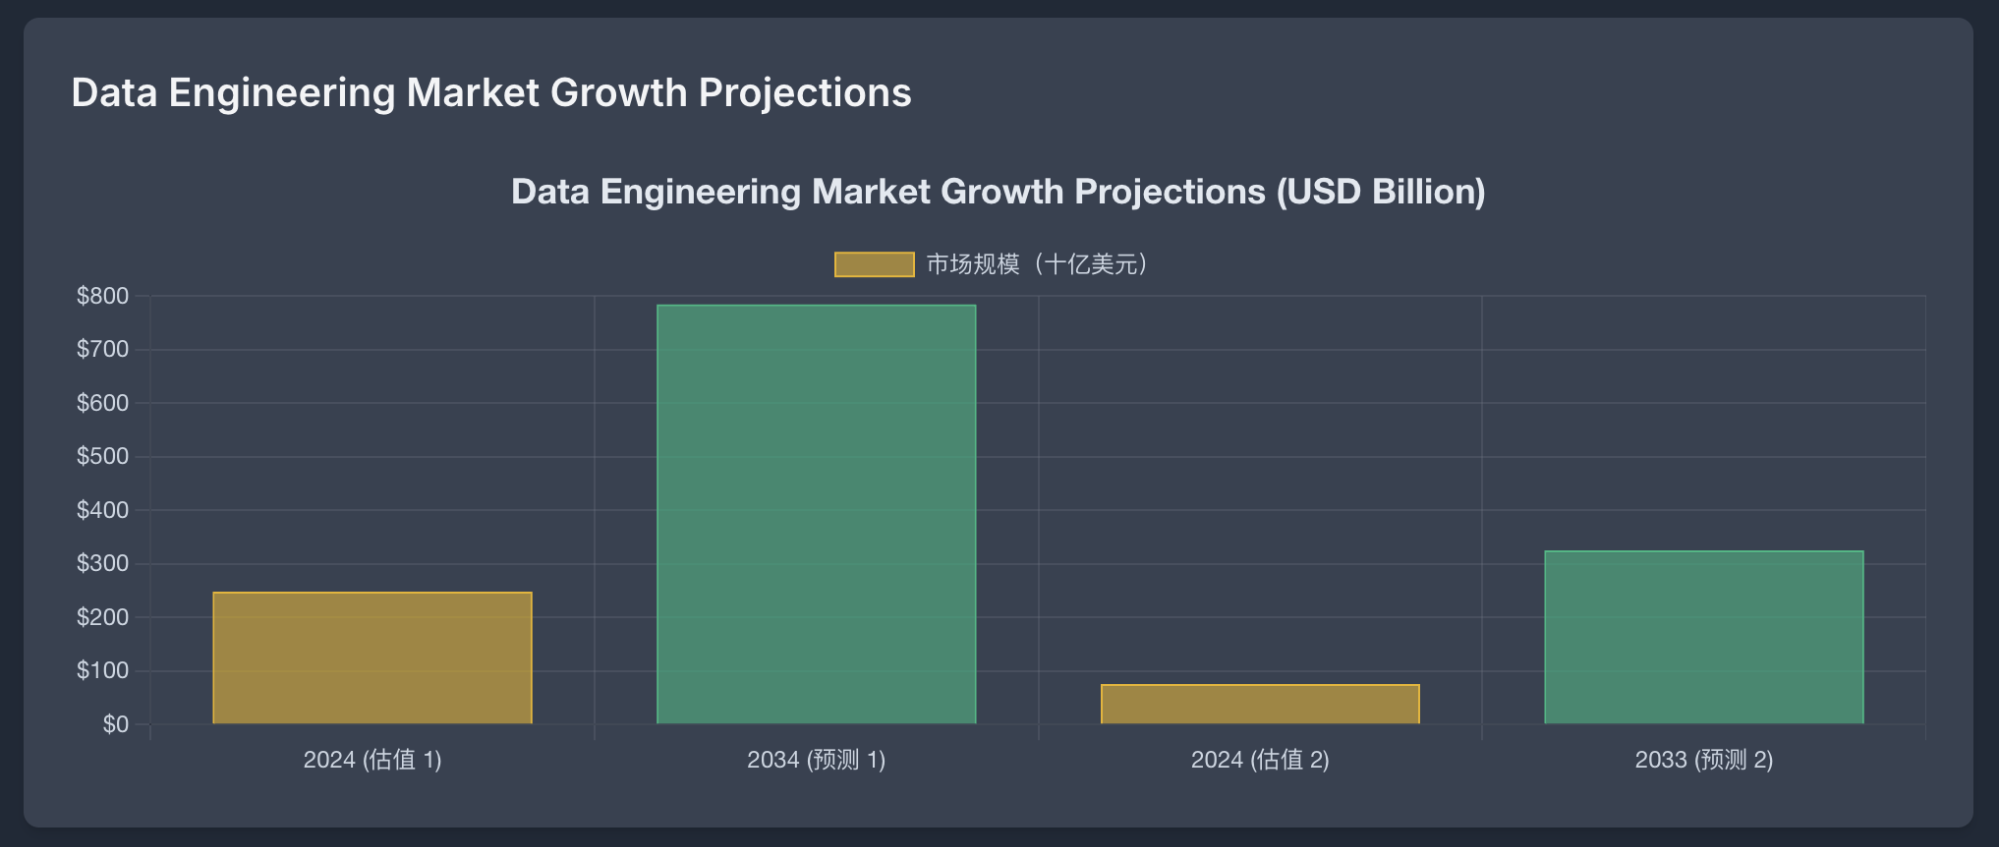
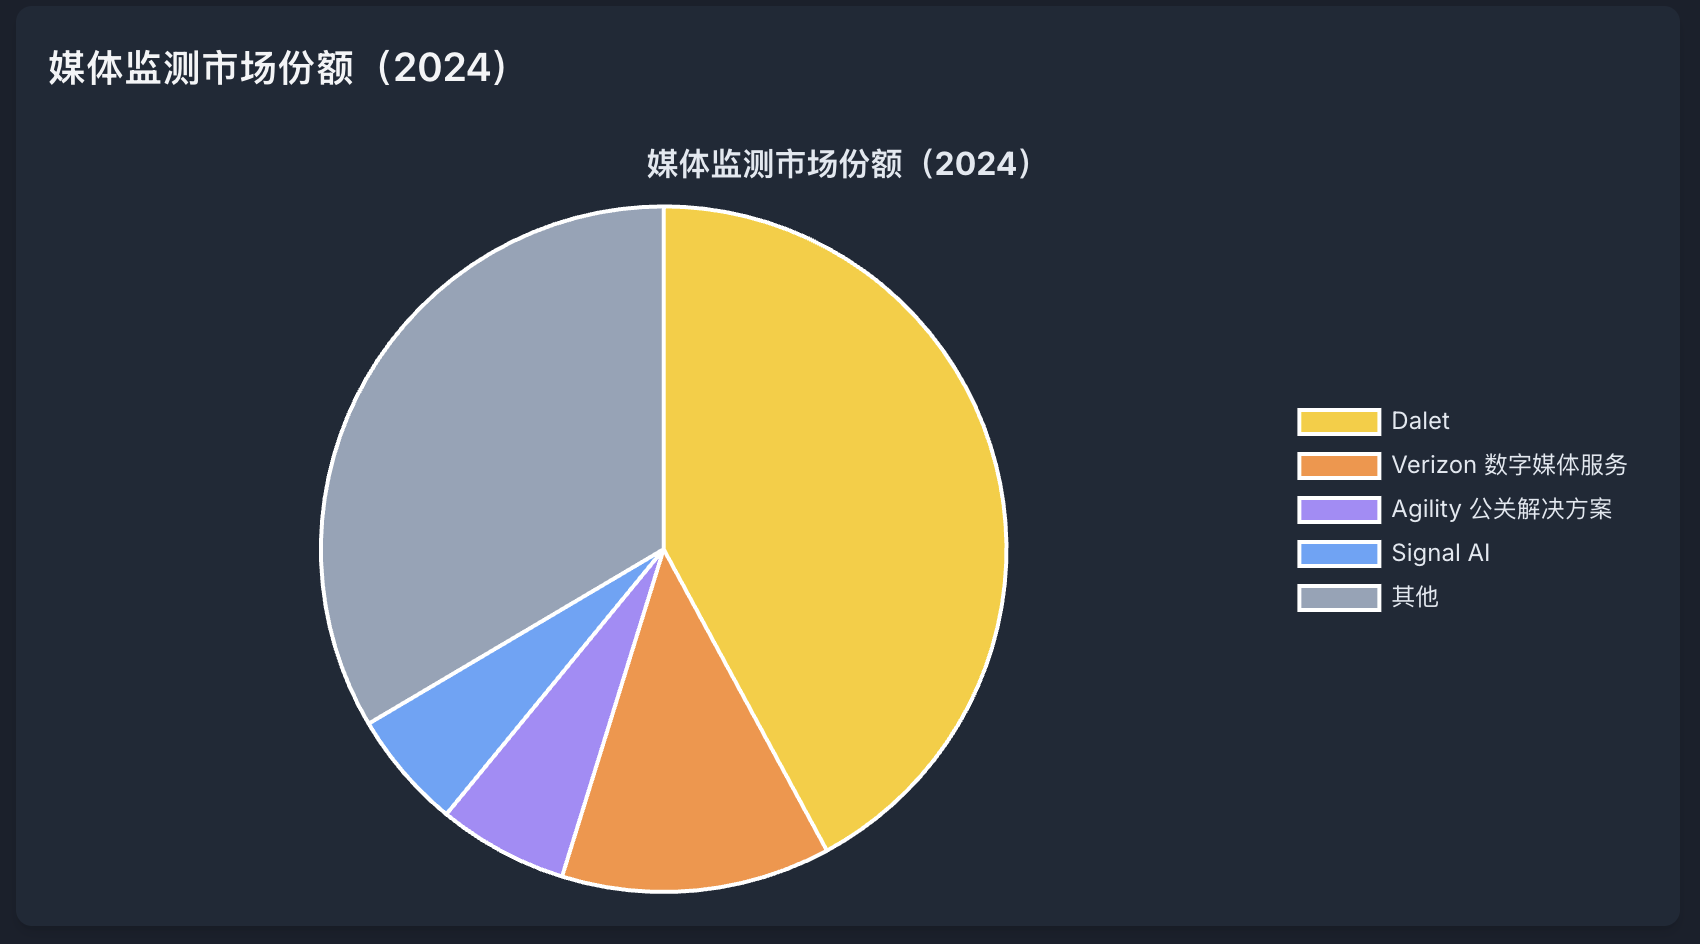
Industry Landscape and Competition
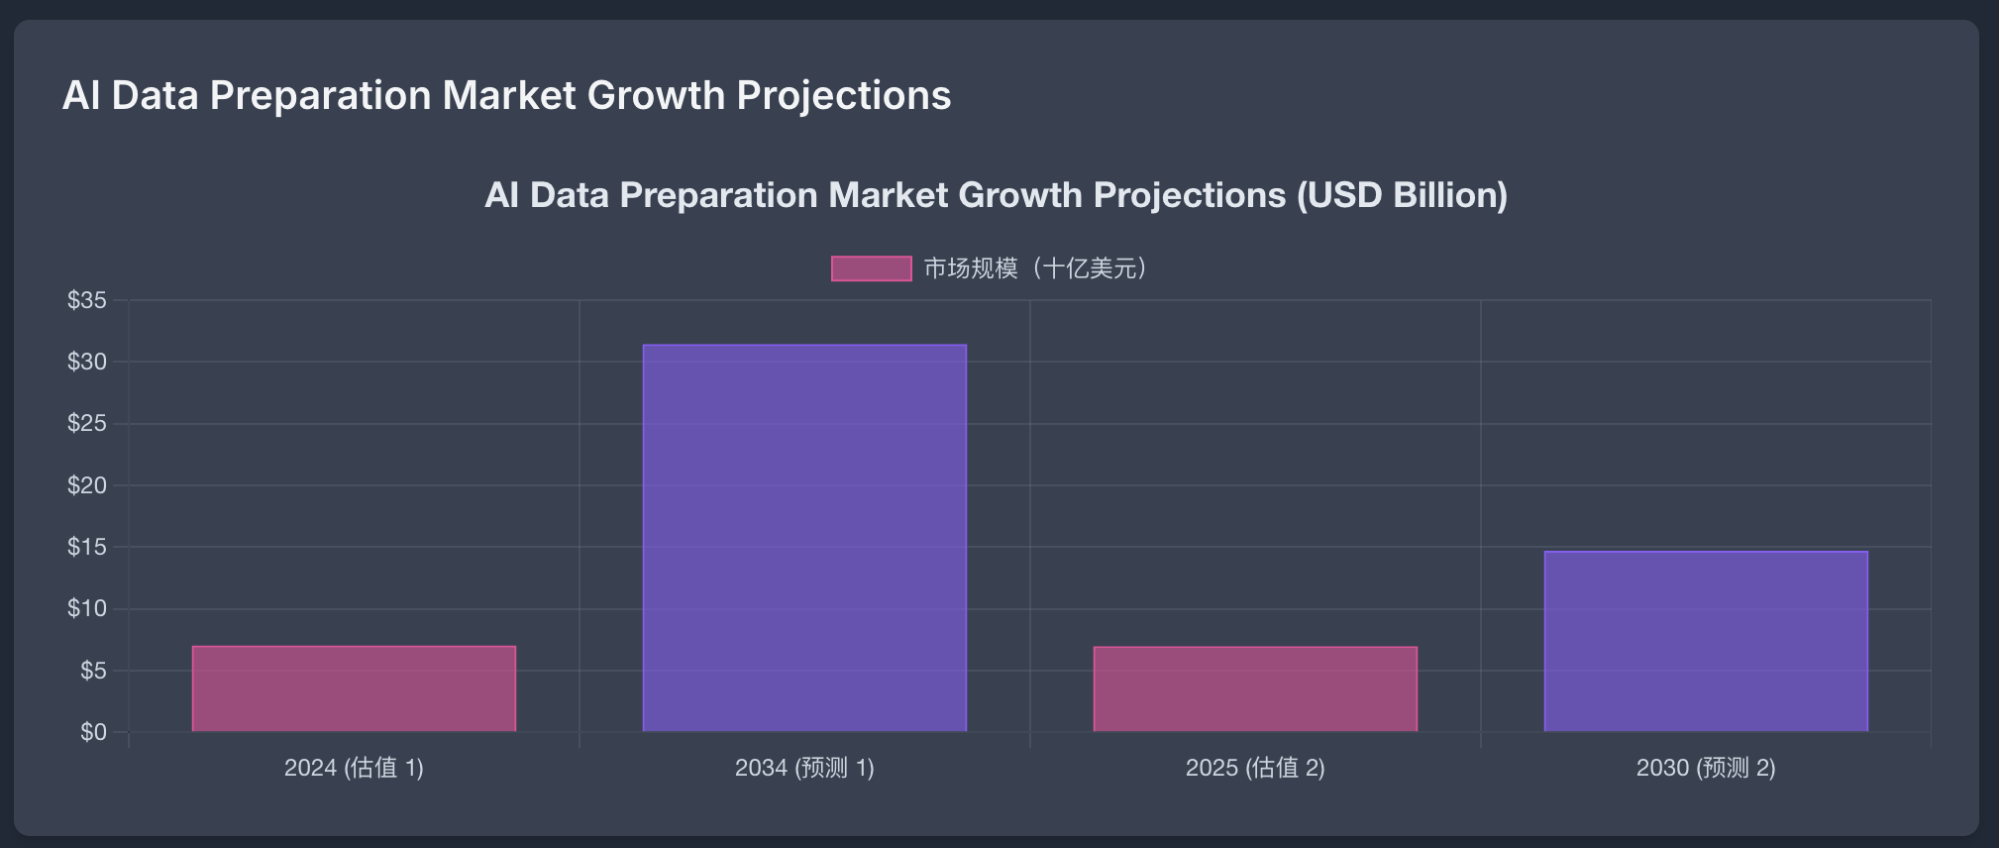
Innodata is positioned in the high-growth trajectories of digital transformation, data engineering, and AI data preparation.
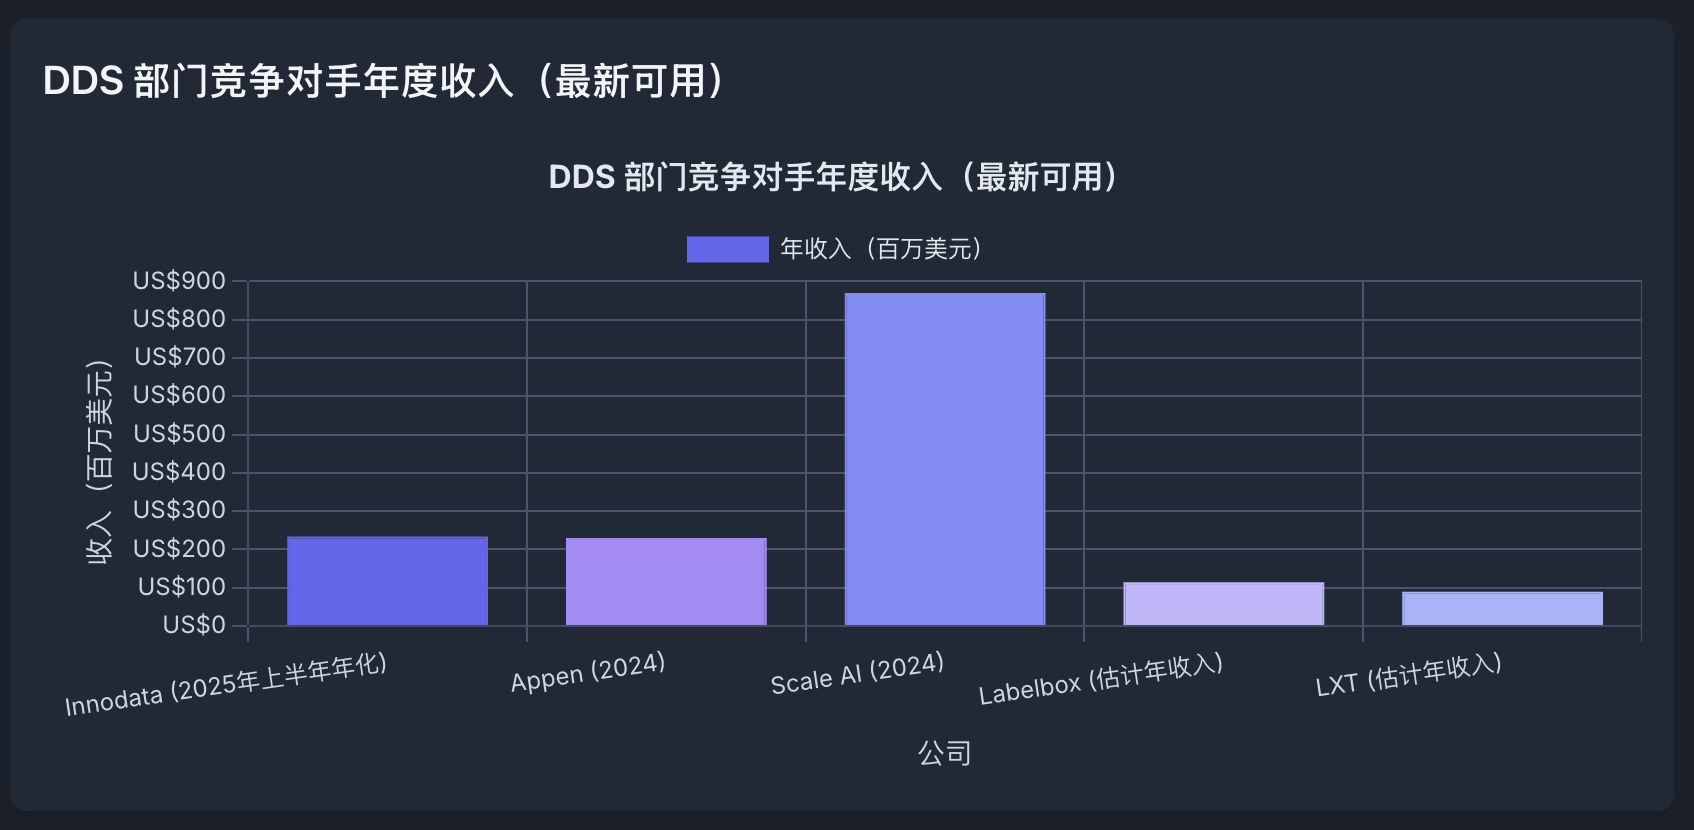
Major Competitors:
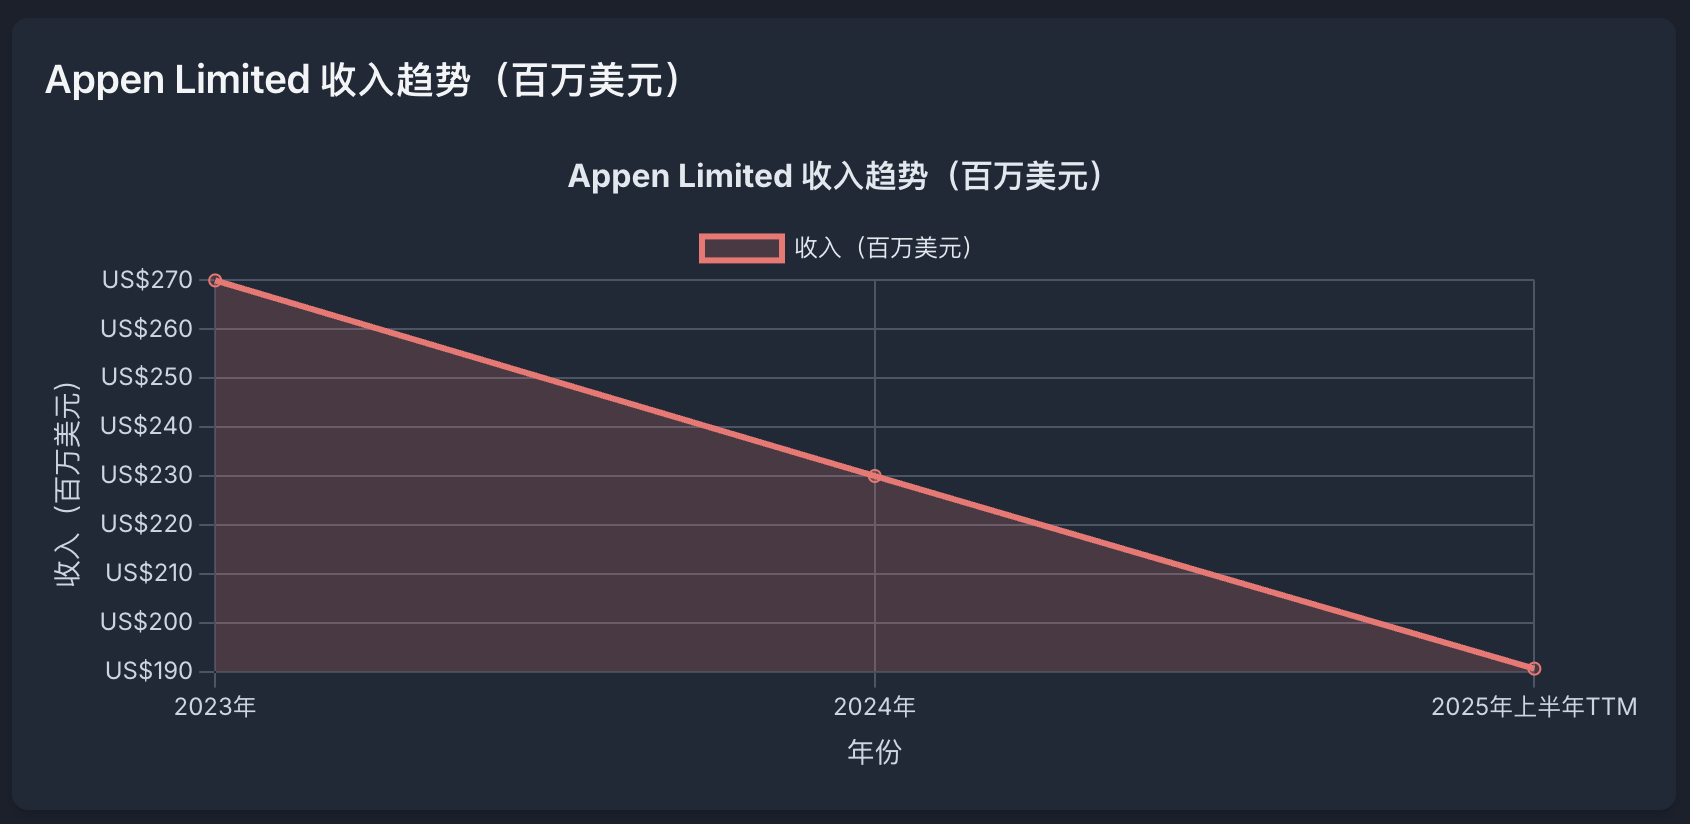
- Appen (APX): Significant market share holder, but recently experiencing revenue declines.
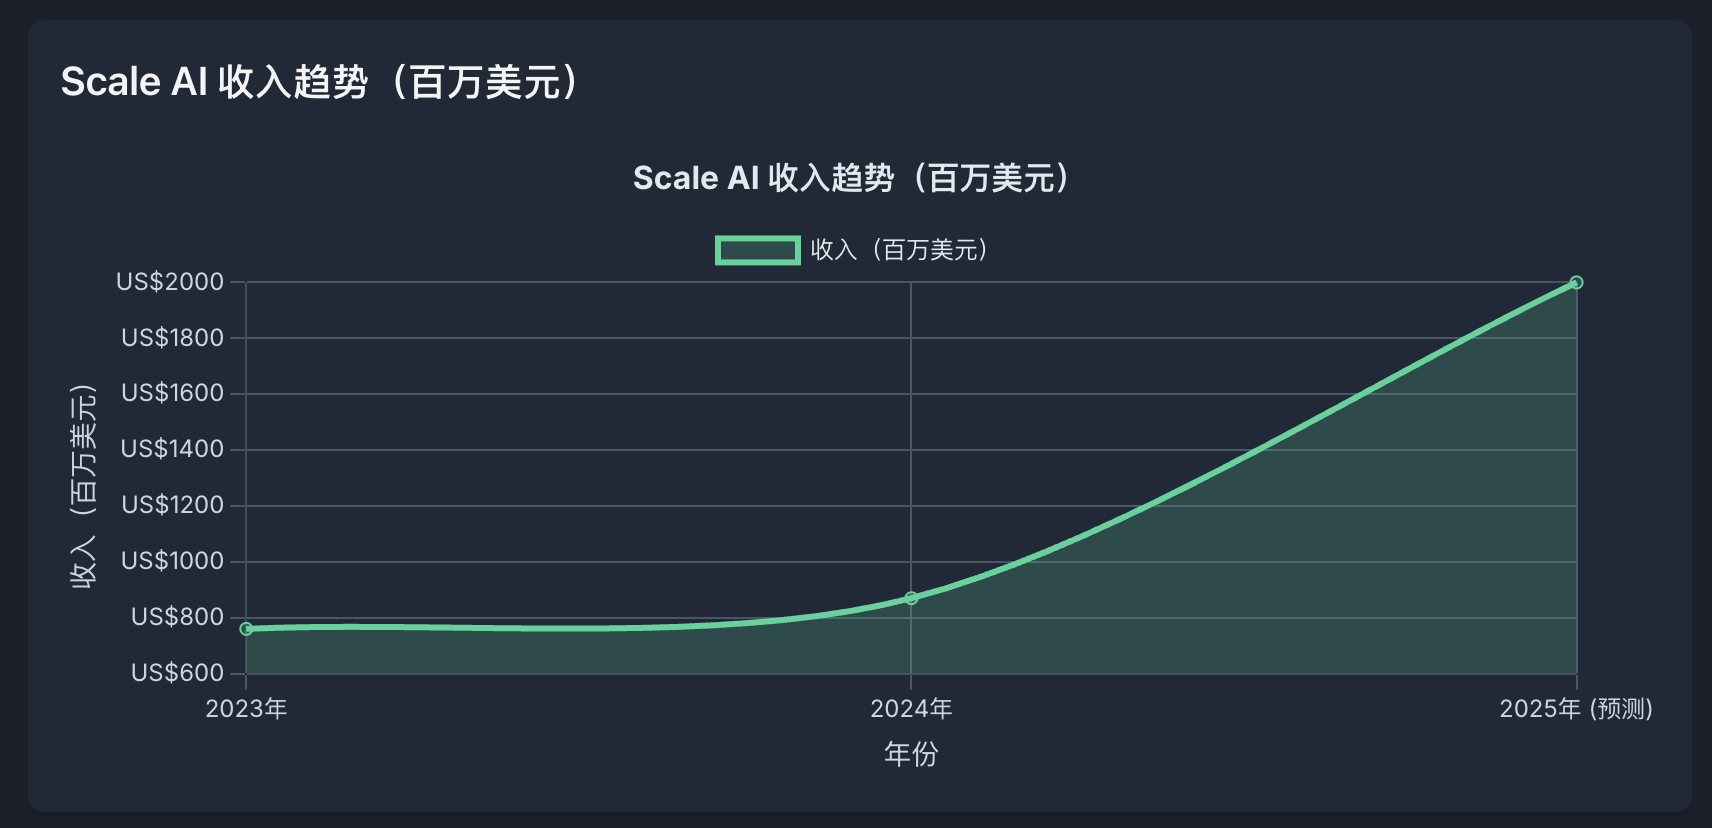
- Scale AI: A private powerhouse with massive valuation and a strong data engine approach.
- Labelbox: Focused on a data-centric AI platform.
SWOT Analysis
- Strengths: Proprietary tech, strong Big Tech relationships (including 5 of the "Mag 7"), healthy balance sheet.
- Weaknesses: Client concentration risk, high stock volatility.
- Opportunities: Booming AI market, rise of Agentic AI.
- Threats: Intense industry competition, regulatory changes, macro-economic downturn affecting client spend.
Management Evaluation
CEO Jack Abuhoff leads with 37+ years of experience. Under his tenure, the company successfully executed a strategic pivot to AI, driving 96% revenue growth in 2024.
Innovation Pipeline and Risks
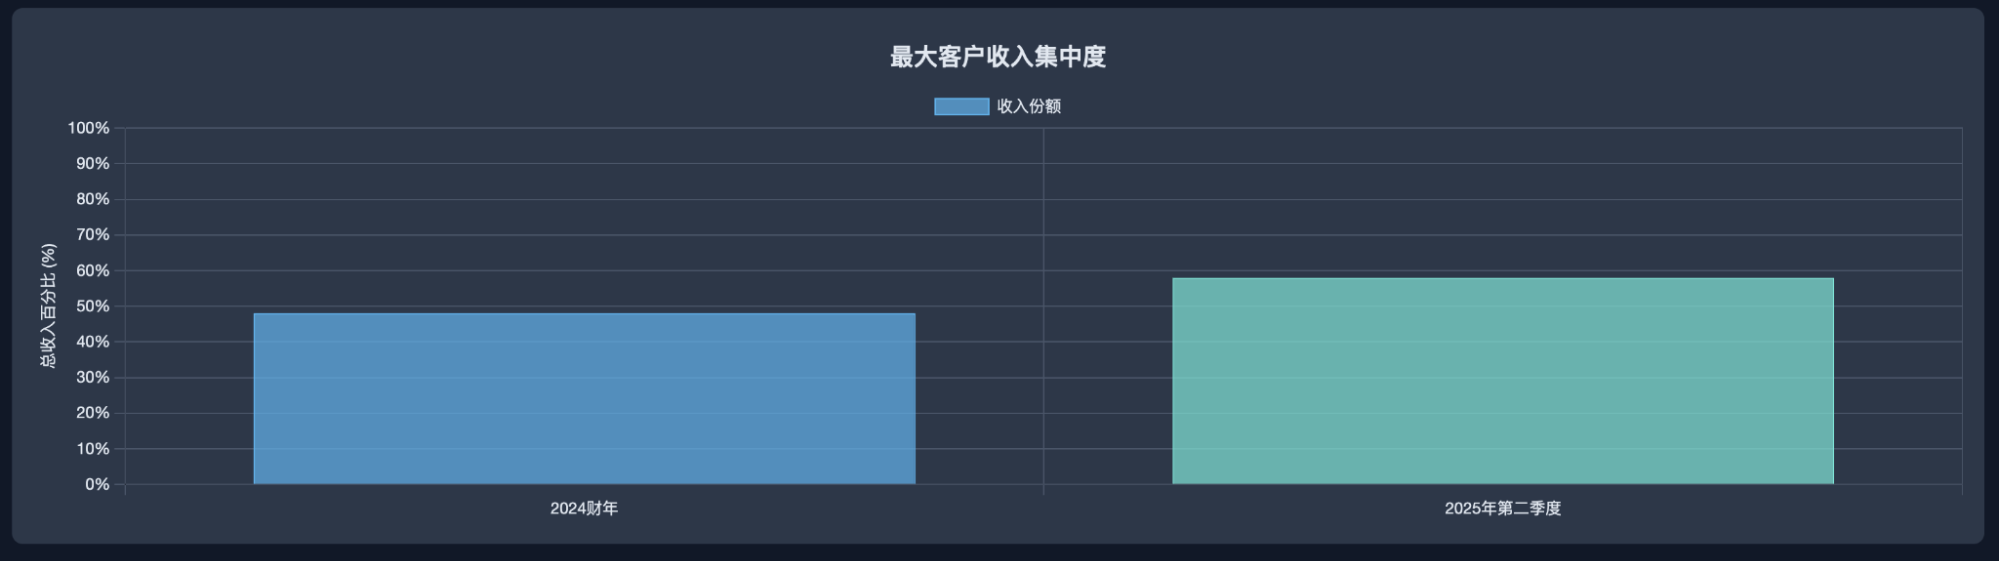
The company is leaning into Agentic AI and its proprietary Goldengate foundational AI platform. Core risks include extreme customer concentration (largest client is 58% of revenue) and legal allegations regarding "AI Washing."
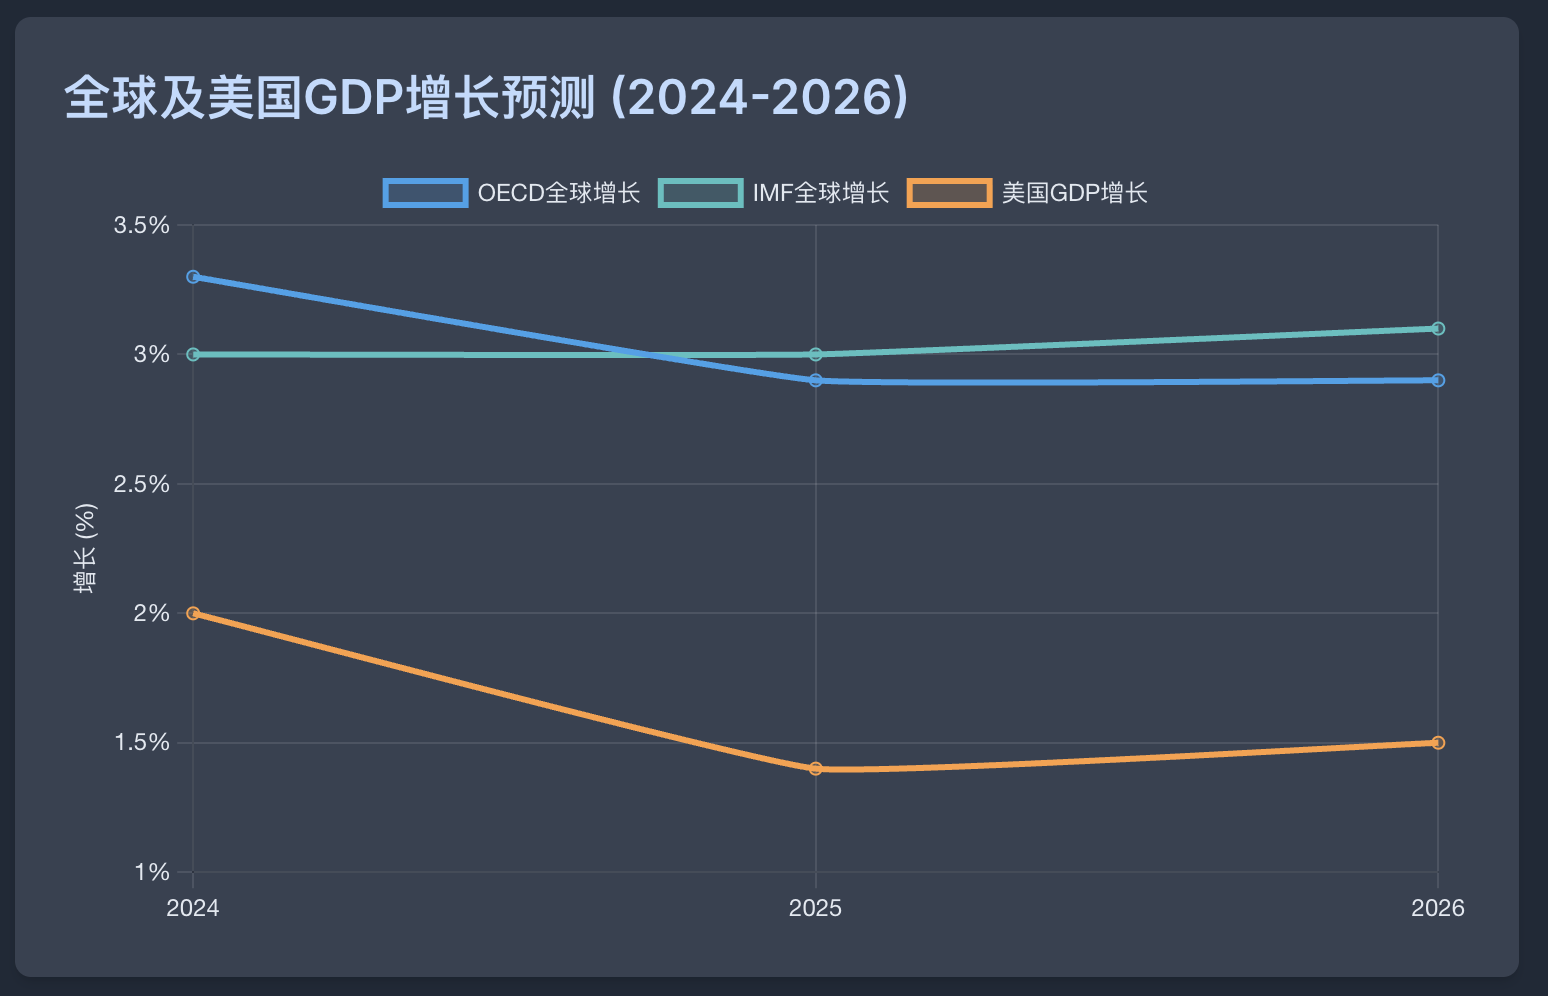
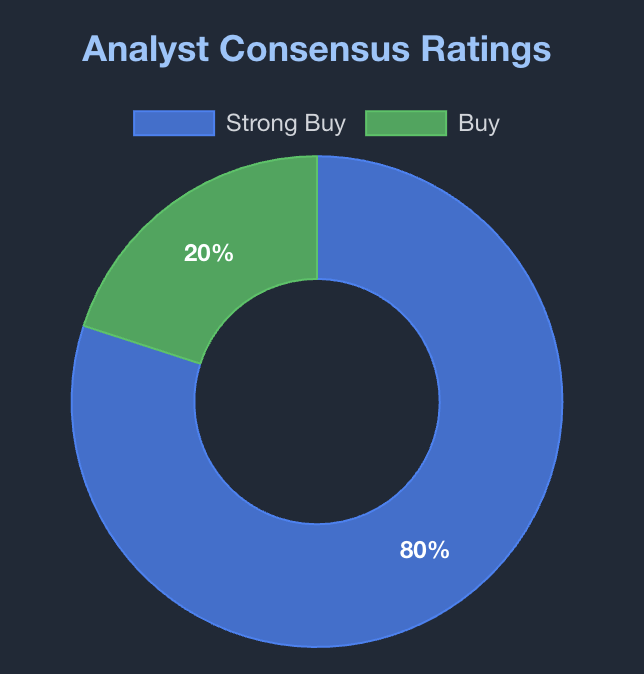
Analyst Sentiment and Macro Impact
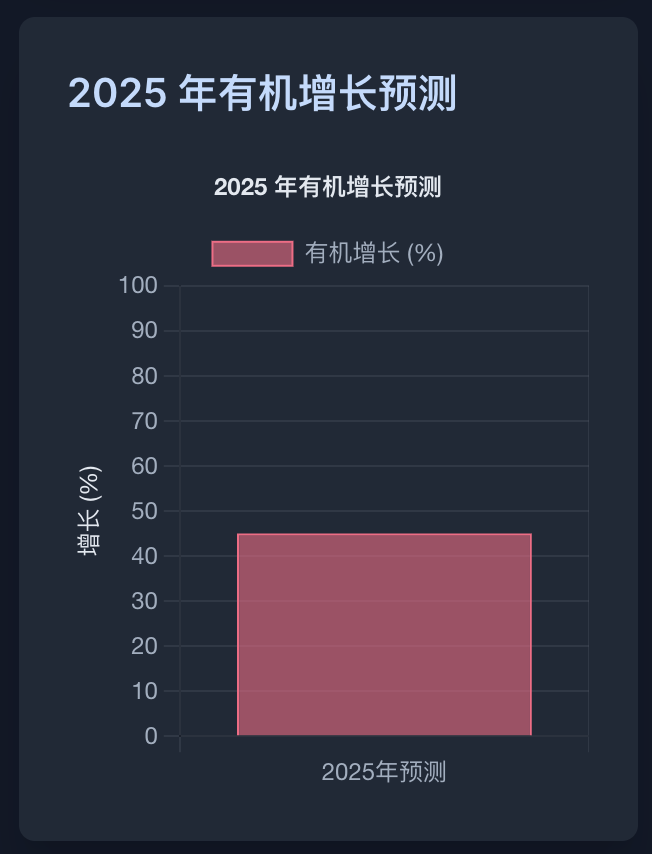
Analysts are strongly bullish ("Strong Buy") with an average price target of $64.40.
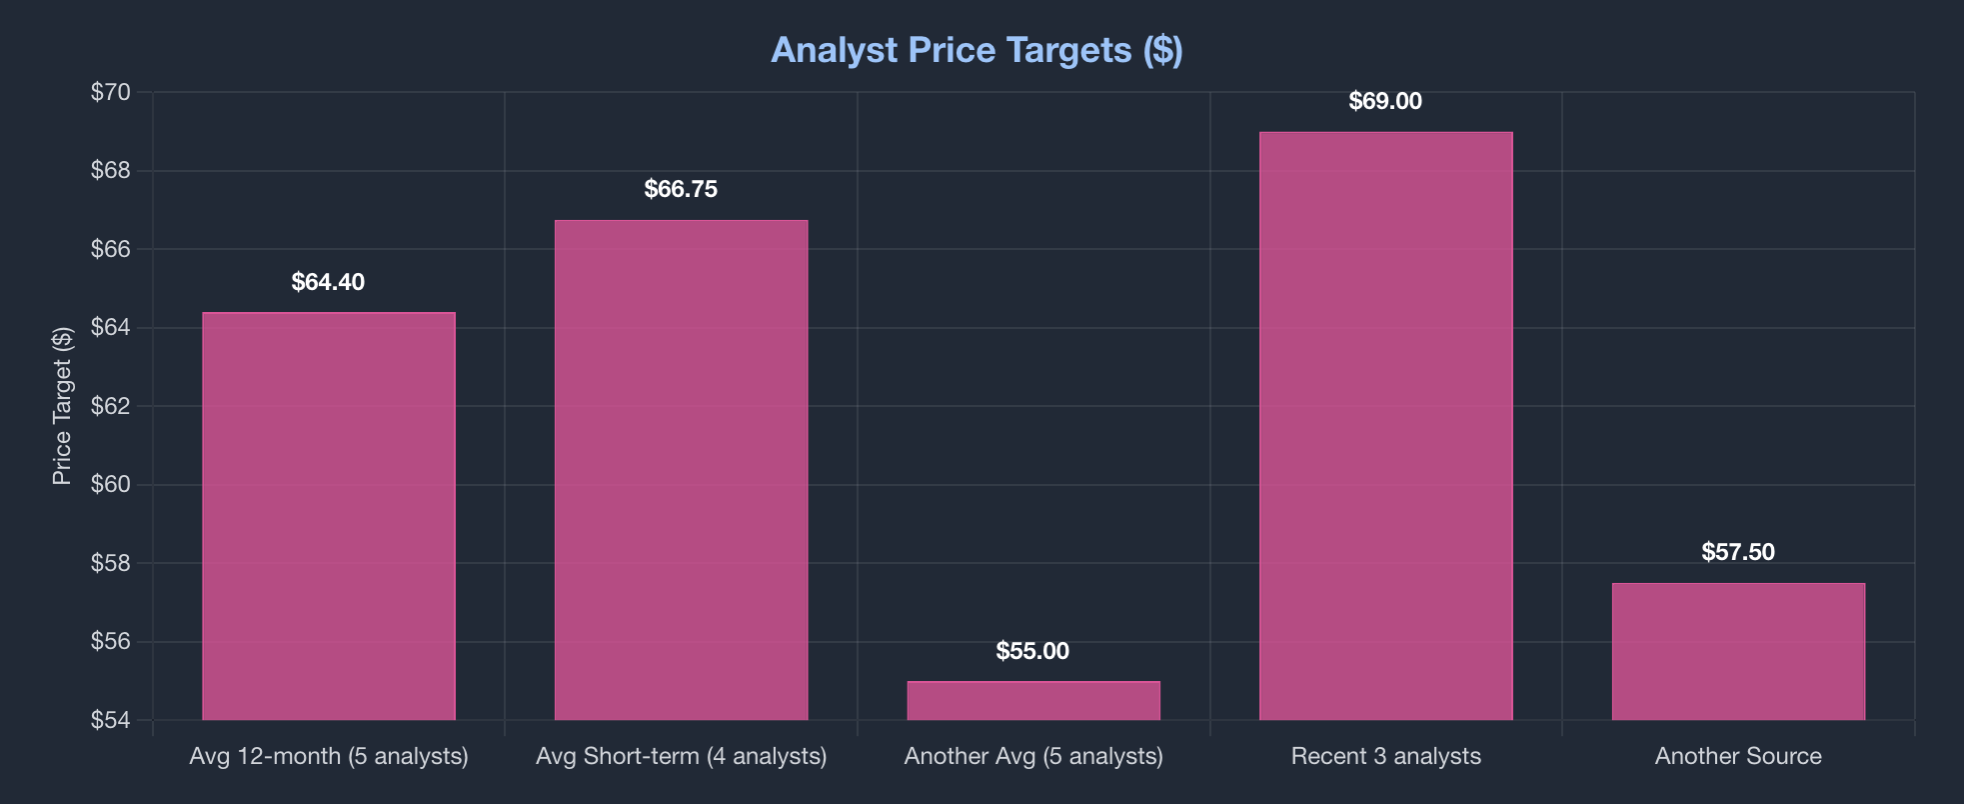
Macroeconomically, while GDP slowdowns might create pressure, the high priority of AI spending may insulate Innodata from the worst impacts.