This KPMG report provides an in-depth review of the 2024 Initial Public Offering (IPO) markets in the Chinese Mainland and Hong Kong, with an outlook for 2025. The report aims to analyze key trends, challenges, and opportunities in the global and local IPO markets.
Chinese Mainland and Hong Kong IPO Market Outlook
The report's table of contents outlines three main sections that will be analyzed sequentially:
- Global IPO Overview
- A-share IPO Market
- Hong Kong IPO Market
The first section looks at the global IPO landscape, providing macro context for understanding the performance of the Chinese Mainland and Hong Kong markets.
Global major IPO markets in 2024 showed signs of improvement, with enhanced IPO performance and boosted investor confidence. Key factors influencing the market include:
- Geopolitical conflicts
- Election results
- Interest rate cuts
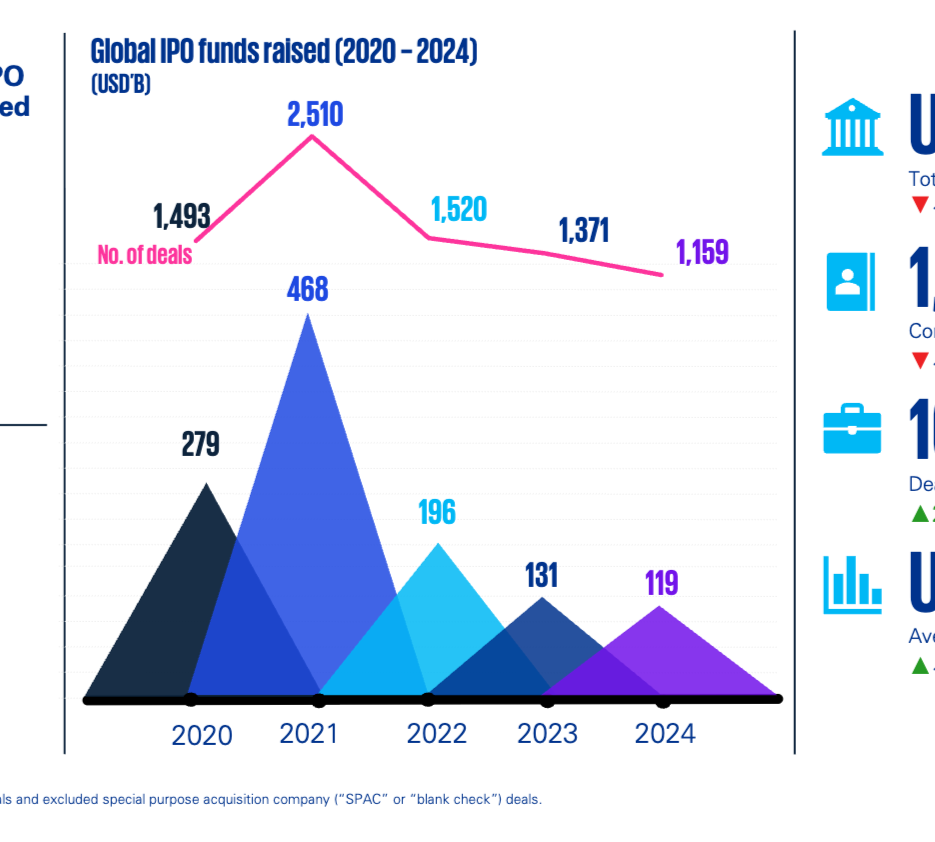
Global IPO Fundraising Amount (2020-2024)
This bar chart illustrates the trends in global IPO fundraising (USD billions) and transaction volume from 2020 to 2024. Fundraising reached a peak of $251 billion in 2021 and has since declined annually to $115.9 billion in 2024. Transaction volume followed a similar trend, dropping from 468 deals in 2021 to 119 in 2024. This indicates a slowdown in global IPO activity following a peak period.
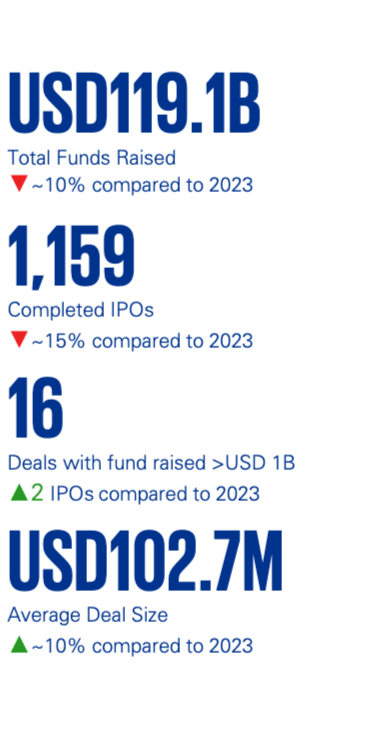
Global IPO Market: 2024 Key Data
This infographic displays key metrics for the global IPO market in 2024. Total fundraising was $119.1 billion, a 10% decrease from 2023. Completed IPOs totaled 1,159, down 15% from 2023. There were 16 deals raising over $1 billion, an increase of 2 over 2023. Average deal size was $102.7 million, down 10% from 2023. Collectively, these data points paint a picture of a slowing global IPO market in 2024, despite some highlights in large-scale transactions.
The consumer market was one of the leading sectors in the top ten IPOs by fundraising amount in 2024, demonstrating its significant position in the global IPO market.
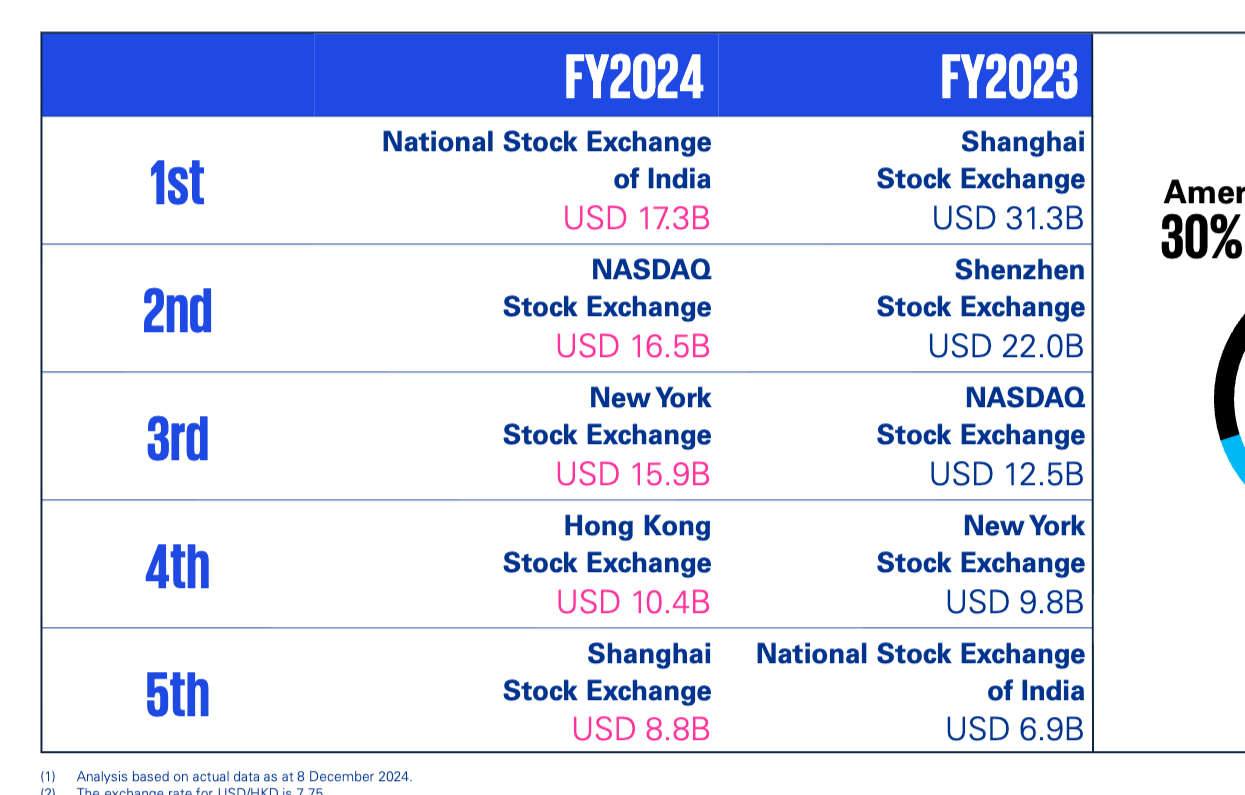
2024 Global IPO Rankings
This table compares the top five global stock exchanges for IPOs in FY2024 and FY2023. In FY2024, the National Stock Exchange of India topped the list with $17.3 billion raised, followed by NASDAQ and the New York Stock Exchange. The Hong Kong Stock Exchange ranked fourth with $10.4 billion raised, while the Shanghai Stock Exchange ranked fifth. This shows shifting relative importance among exchanges over the two years, particularly a decline in rankings for mainland Chinese exchanges.
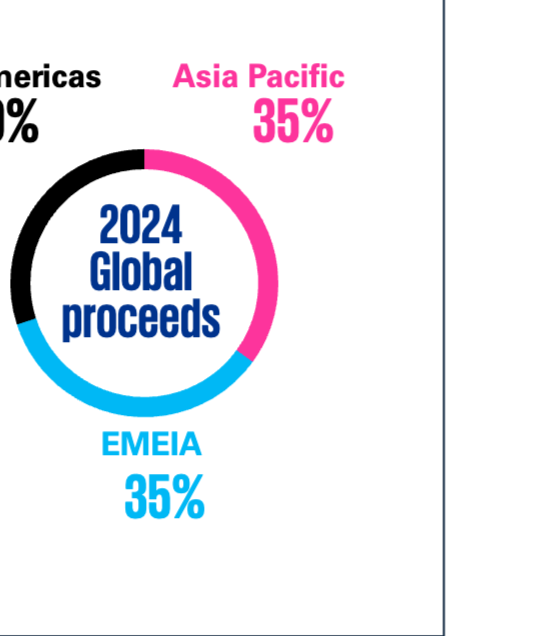
2024 Global IPO Fundraising Regional Distribution
This donut chart shows the regional distribution of global IPO fundraising in 2024. The Americas contributed 30%, while Asia-Pacific and EMEIA (Europe, Middle East, India, and Africa) contributed 35% each. This indicates that the Asia-Pacific and EMEIA regions dominated global IPO fundraising in 2024.
KPMG partner Paul Lau noted that the global IPO market (excluding Asia-Pacific) showed growth momentum in 2024, suggesting cautious optimism for 2025. However, uncertainties in trade policy and geopolitics, particularly influenced by the new US administration, cast a shadow over this outlook. Collaboration among stakeholders is crucial to maintaining stable growth and prosperity in global capital markets.
Total Fundraising by Region – 2024 vs 2023
This infographic shows changes in regional fundraising amounts compared to 2023. Fundraising in the Americas grew by approximately 50%, and EMEIA grew by about 40%. Conversely, fundraising in the Asia-Pacific region dropped by approximately 50%. This highlights significant regional performance disparities in the global IPO market.

Next, the report delves into the A-share IPO market, a vital component of the Chinese Mainland's capital market.
The pace of new A-share listings was slow in 2024, with Real Estate Investment Trusts (REITs) becoming a major driver of listing activity.
- Total fundraising was RMB 119.1 billion, down 70% from 2023.
- Completed IPOs numbered 125, down 60% from 2023.
- Average deal size was RMB 96 million, a 20% decrease from 2023.
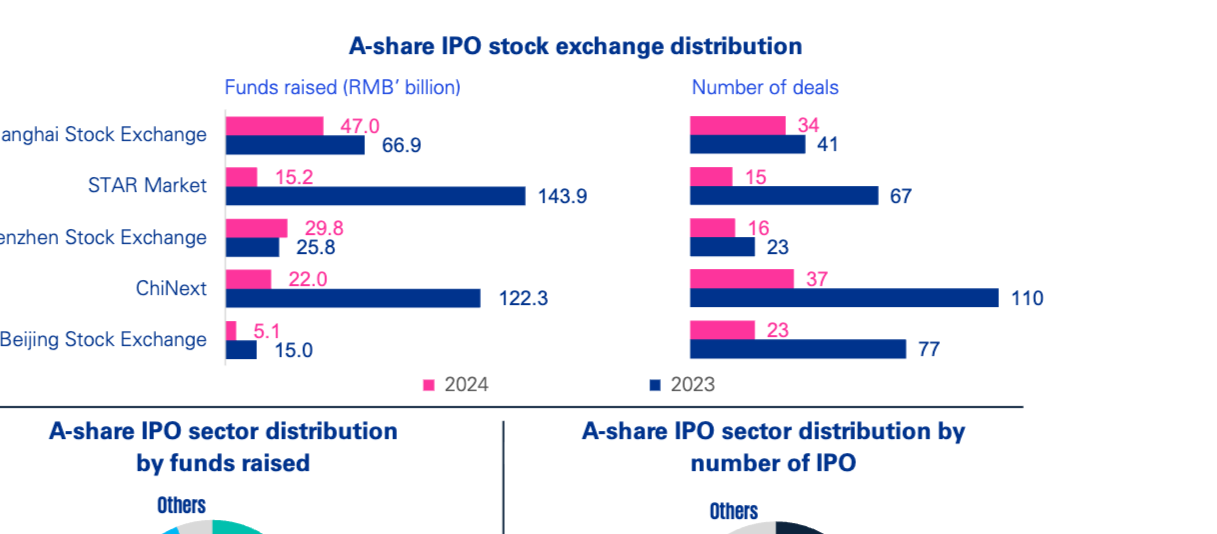
A-share IPO Exchange Distribution
This chart displays the distribution of A-share IPO fundraising (RMB 100 million) and transaction volume across different boards (Shanghai Main Board, STAR Market, Shenzhen Main Board, ChiNext, and Beijing Stock Exchange) for 2024 and 2023. In terms of fundraising, the Shanghai Stock Exchange raised RMB 47 billion in 2024, STAR Market RMB 15.2 billion, Shenzhen Stock Exchange RMB 29.8 billion, ChiNext RMB 22 billion, and Beijing Stock Exchange RMB 5.1 billion. In terms of volume, Shanghai had 34 deals, STAR 15, Shenzhen 16, ChiNext 37, and Beijing 23. Overall, both fundraising and deal volume across all exchanges declined compared to 2023, particularly on the STAR and ChiNext boards.
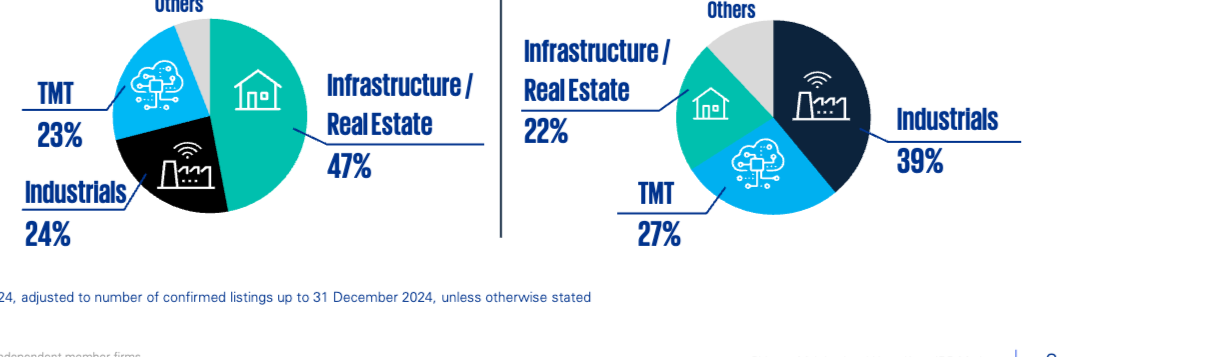
A-share IPO Sector Distribution
These two donut charts show the sector distribution of A-share IPOs by fundraising amount and IPO volume in 2024. By fundraising amount, Infrastructure/Real Estate accounted for 47%, TMT for 23%, and Industrials for 24%. By volume, Industrials led with 39%, followed by TMT at 27% and Infrastructure/Real Estate at 22%. This indicates that while Infrastructure/Real Estate excelled in funds raised, Industrials dominated the number of IPOs.
Top Ten A-share IPOs
This table lists the top ten A-share IPOs by fundraising amount for 2024 and 2023, including company name, exchange, funds raised (RMB 100 million), and sector. In 2024, the top ten were concentrated in the Infrastructure/Real Estate sector, with the China Commercial Retail Assets REIT topping the list at RMB 6.9 billion. This marks a shift from 2023, where the top ten were primarily in traditional markets like TMT and Industrials.
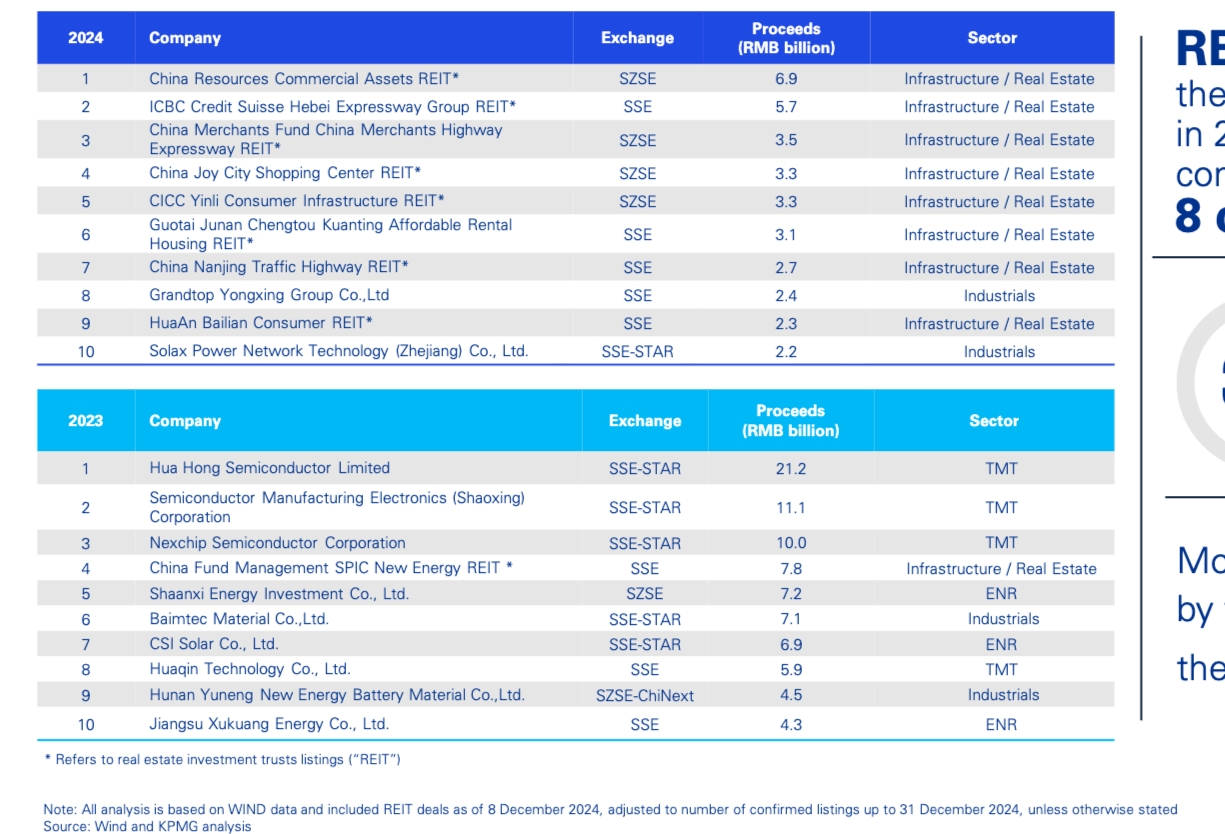
In 2024, REITs dominated A-share fundraising, occupying 8 of the top 10 IPO slots, showing strength in this niche segment.
- The top ten IPOs accounted for 30% of the year's total fundraising.
- Most of the top ten IPOs (by fundraising) came from traditional markets, emphasizing the importance of traditional industries in the current climate.
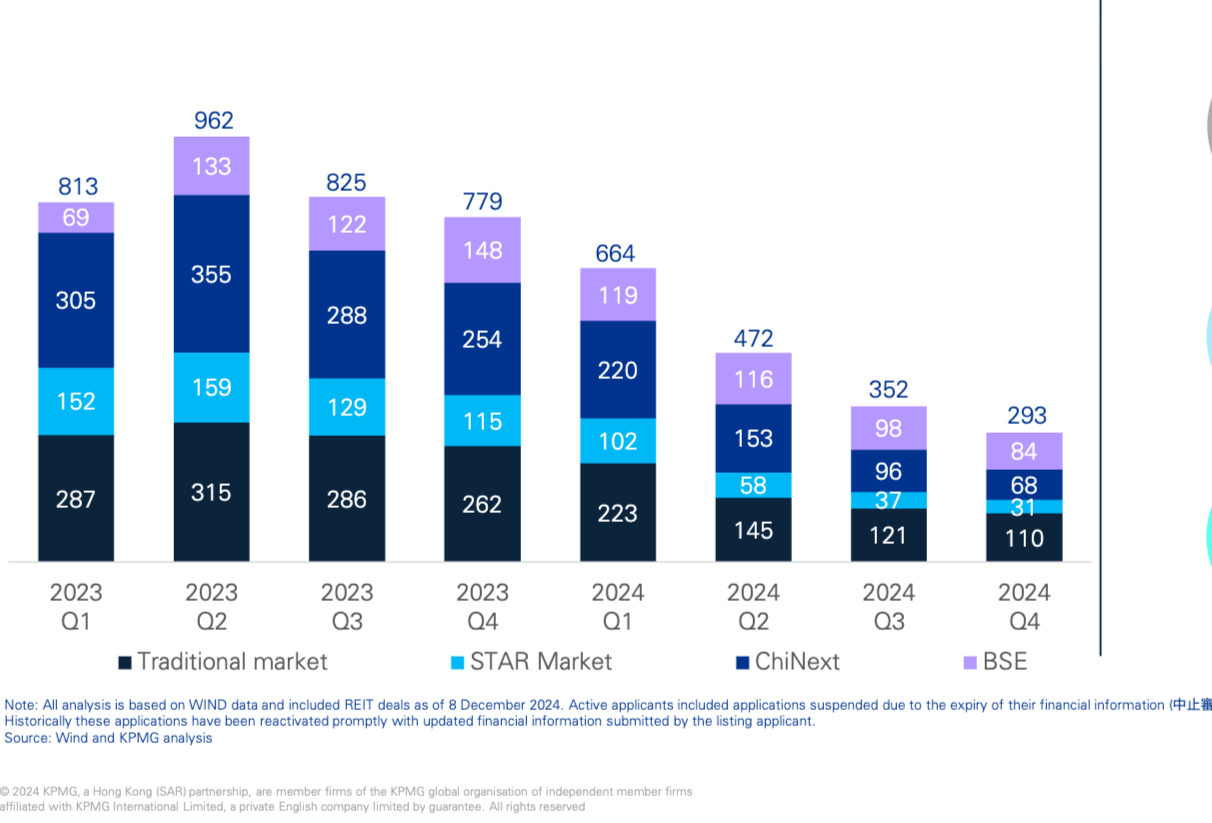
A-share IPO Pipeline: Active Applicants
This stacked bar chart shows the number of active A-share IPO applicants from Q1 2023 to Q4 2024, broken down by market (Main Board, STAR Market, ChiNext, Beijing Stock Exchange). Overall, active applicants are on a downward trend, from 813 in Q1 2023 to 293 in Q4 2024. The Main Board maintained the largest share each quarter, but all markets saw a reduction in applicants.
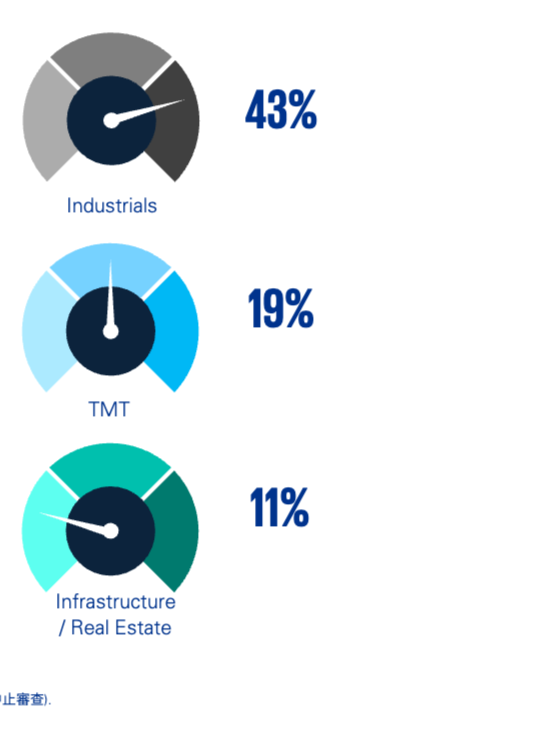
Top Three Sectors for A-share IPO Applicants
These three donut charts show the distribution of the top three sectors for A-share IPO applicants. Industrials accounted for 43%, TMT for 19%, and Infrastructure/Real Estate for 11%. This indicates that Industrials is the most active sector for current applicants, even if it trails Infrastructure/Real Estate in fundraising totals.
KPMG expects A-share IPO activity to remain stable, with a focus on strengthening the quality of listed companies and improving the overall capital market. Chinese companies are seeking Hong Kong listings to leverage connectivity mechanisms, providing global investors with valuable market access and solidifying Hong Kong's status as an international financial center.
Hong Kong IPO Market
The Hong Kong IPO market demonstrated strong resilience, returning to the global top five. Data as of December 8, 2024 shows:
- Total fundraising: HKD 82.9 billion, a YoY decrease of approx. 80%.
- Completed IPOs: 63, down 7 from the previous year.
- Average deal size: HKD 1.3 billion, a YoY decrease of approx. 100%.
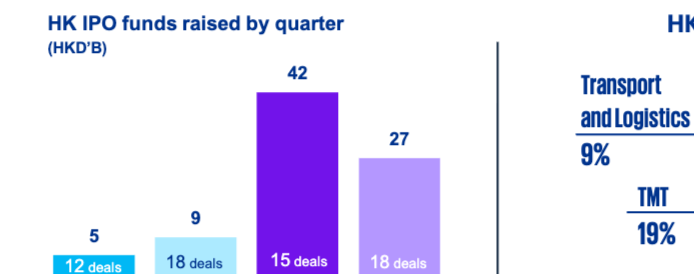
Hong Kong IPO Quarterly Fundraising (HKD billions)
This column chart shows funds raised in the Hong Kong IPO market by quarter and deal volume. Q3 2024 saw the highest fundraising at HKD 42 billion with 15 deals; Q4 saw HKD 27 billion with 18 deals. The number of deals per quarter is also displayed below the chart.
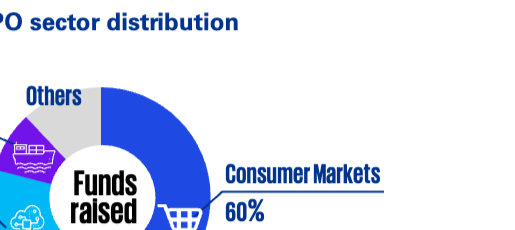
Hong Kong IPO Sector Distribution
This pie chart shows the sector distribution of the HK IPO market, where the Consumer Market represents the largest share at 60%. TMT (Technology, Media, Telecom) accounts for 19%, Transport & Logistics for 9%, and other sectors for 6%, with the remainder in fund raising.
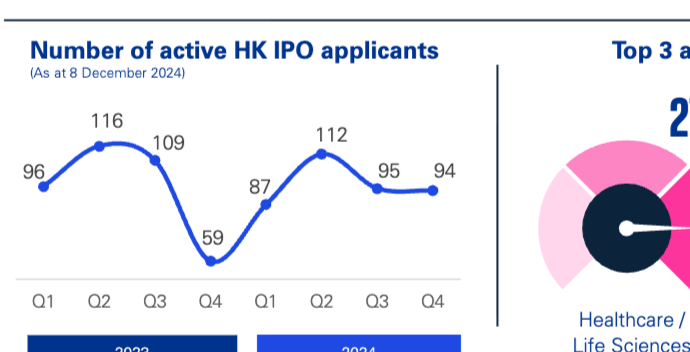
Number of Active Hong Kong IPO Applicants (as of Dec 8, 2024)
This line graph shows the quarterly number of active IPO applicants in Hong Kong. Starting from 96 companies in Q1 2023, the number fluctuated before reaching 94 in Q4 2024, showing that application activity stabilized throughout 2024.
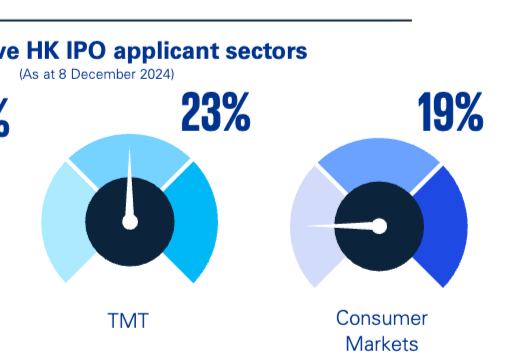
Top Three Active Sectors for Hong Kong IPO Applicants (as of Dec 8, 2024)
This group of three donut charts displays the top active sectors for HK IPO applicants: Healthcare/Life Sciences at 27%, TMT at 23%, and Consumer Market at 19%. This highlights the relative activity levels of different industries.
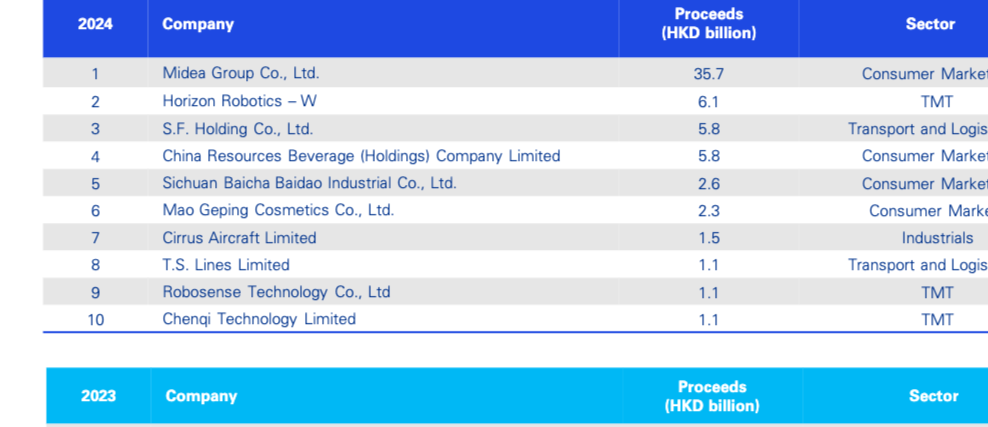
Top Ten Largest Hong Kong IPOs of 2024
This table lists the top ten largest IPOs in Hong Kong for 2024, ranked by funds raised (HKD billions) and sector. Midea Group Co., Ltd. topped the list with HKD 35.7 billion, belonging to the Consumer Market sector.
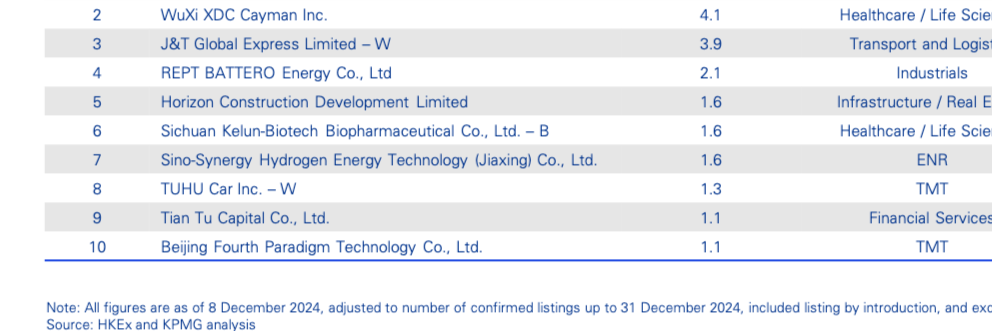
Top Ten Largest Hong Kong IPOs of 2023
This table lists the top ten largest IPOs in Hong Kong for 2023. Archosaur Games topped the list with HKD 530 million, belonging to the Consumer Market.
In both 2023 and 2024, the largest IPOs by fundraising came from the Consumer Market. In 2024, TMT ranked high among the top ten, representing 76% of those IPOs.
The Hong Kong IPO market, backed by positive momentum and growing investor confidence, is becoming an increasingly attractive choice for applicants. Measures by the CSRC to encourage mainland enterprises to list in Hong Kong and the mainland, combined with upcoming loose monetary policies, will further boost the pipeline. Additionally, the inclusion of Middle Eastern stock exchanges in the recognized list is expected to drive steady growth in secondary listings for 2025, with IPO scale expected to remain stable.
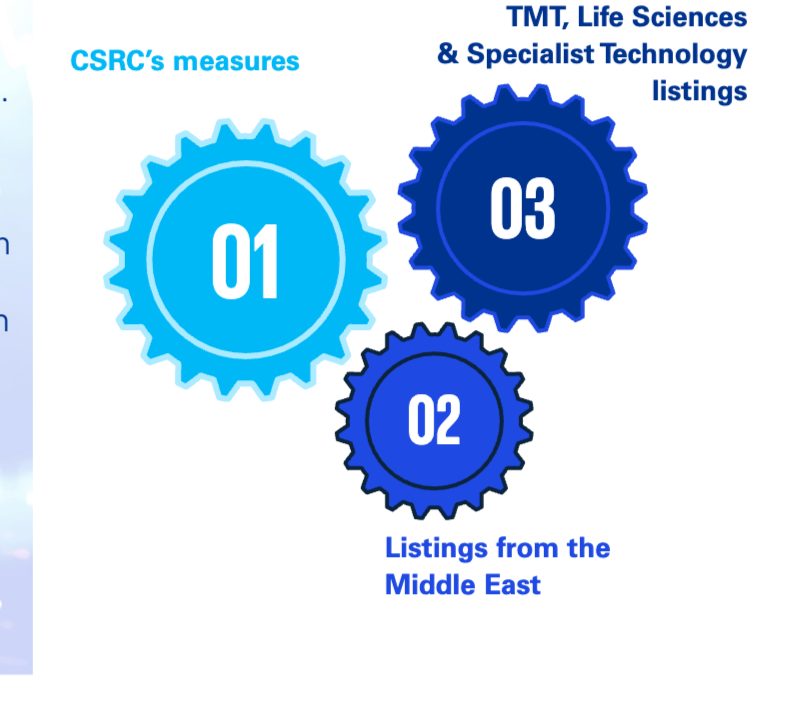
Driving Factors for Hong Kong IPO Market Outlook 2025
This image illustrates the primary drivers for the Hong Kong IPO market in 2025:
- CSRC's measures.
- Listings from the Middle East.
- TMT, Life Sciences & Specialist Technology listings.